The Evolution of Embedded Reporting: 7 Stages

 18 mins
TL;DR:
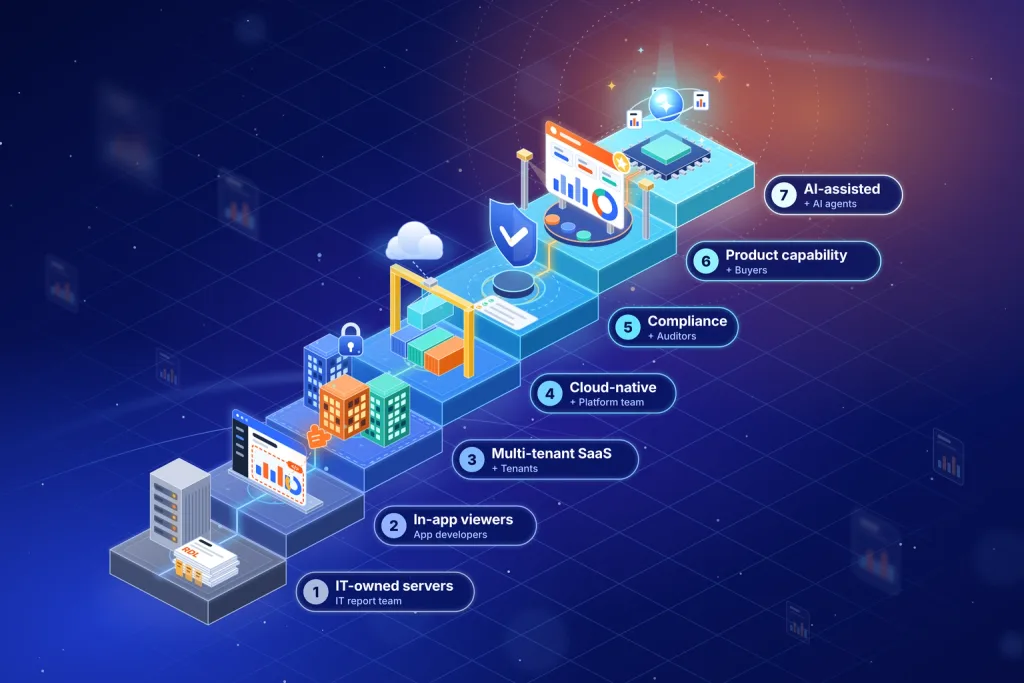
Embedded reporting evolved through seven stages: IT-owned report servers, in-app viewers, multi-tenant SaaS, cloud-native services, governance and compliance, a product-level capability, and AI-assisted workflows. Stages 3 to 6 each added a stakeholder with a say in reporting: the tenant, the platform team, the auditor, and the buyer. Judge any platform on four things: where it renders, which report format stays portable, how it isolates tenants, and what leaving costs.
Disclosure: This guide comes from the Bold Reports® team. Bold Reports is built on RDL, so the portability criteria below reflect that background. Test any vendor, including us, against all four questions.
Introduction
Embedded reporting has moved through seven stages since SSRS shipped in January 2004. This history of embedded reporting dates each stage, shows what it cost the teams building software, and ends with a four-question test that separates platforms better than a feature list: where rendering runs, which report format stays portable, how tenants are isolated, and what leaving costs. Each stage brought in someone new with a say in how reports are built, and that shift runs through the whole history. If you are choosing or replacing a platform in 2026, start with the stage that matches your team's pain today.
What is an embedded reporting platform?
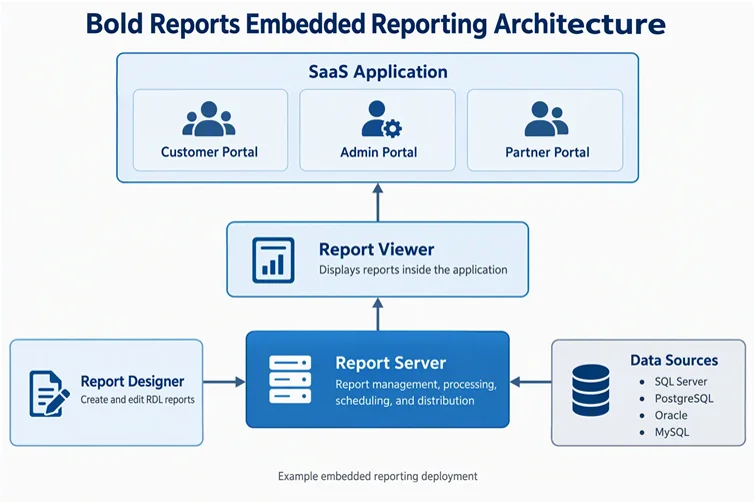
An embedded reporting platform lets a software vendor design, render, secure, schedule, and deliver reports inside its own application, under its own brand. It typically includes a designer, rendering engine, viewer components, data connectors, a security model, and automation APIs. For a fuller definition, see what embedded reporting is.
How is embedded reporting different from embedded analytics?
Embedded reporting delivers defined, repeatable documents such as invoices, statements, and operational reports, with exact layout and controlled distribution. Embedded analytics adds exploration through ad hoc queries, charts, and dashboards. Reporting prioritizes precision and governance; analytics prioritizes flexibility.
Embedded BI moved from static reports in the 1990s to interactive reports and dashboards in the 2000s, and to self-service analytics in the 2010s, according to Eckerson Group’s 2016 analysis for TDWI. Paginated reporting did not disappear in that shift. It remained the format for documents that must look the same every time.
The seven stages of embedded reporting at a glance
Each period is an anchor, not a hard boundary. The stages overlap, and many teams still run several at once.
| Stage | Period anchor | What triggered it | Who owned it or gained a say | What teams had to build |
|---|---|---|---|---|
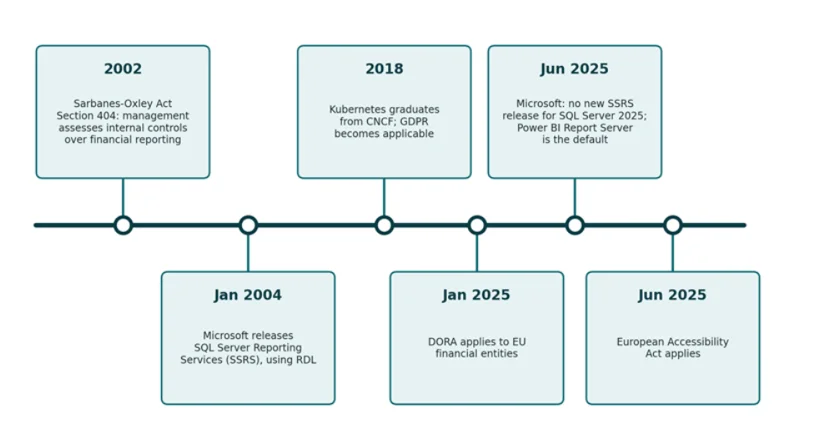
| 1 | 2002 to 2004 (SOX Section 404; SSRS, Jan 2004) | Relational databases and SQL widened access to data; regulation raised the stakes on report accuracy | IT report team | Central report server, banded designers, RDL |
| 2 | Visual Studio 2005 onward | Users resisted switching tools; ISVs wanted branded reports in their own screens | Application developers | Embedded viewers, plus hand-written scheduling, security, and export logic |
| 3 | September 2011 onward (NIST SP 800-145) | SaaS put many customers on one deployment | Tenants | Tenant isolation, per-tenant data sources and theming |
| 4 | 2018 onward (Kubernetes graduates from CNCF) | Reporting load follows customer calendars; data residency | Platform engineering team | Containerized, horizontally scaled, API-driven reporting services |
| 5 | 2018 to 2025 (GDPR 2018; DORA Jan 2025) | Reports became audit evidence | Auditors and compliance teams | Audit trails, version history, enterprise identity, data masking, distribution controls |
| 6 | Ongoing (European Accessibility Act applies June 2025) | Strong reporting became the baseline buyers compare | Buyer’s procurement team, product management | White-labeling, governed self-service, accessible output |
| 7 | November 2024 onward (MCP introduced) | LLMs lowered the cost of turning intent into queries and layouts | AI agents as new report consumers; no new human stakeholder | Governed AI authoring, inherited permissions, audit logging |
Evolution stage 1: What did on-premises, IT-owned reporting look like?
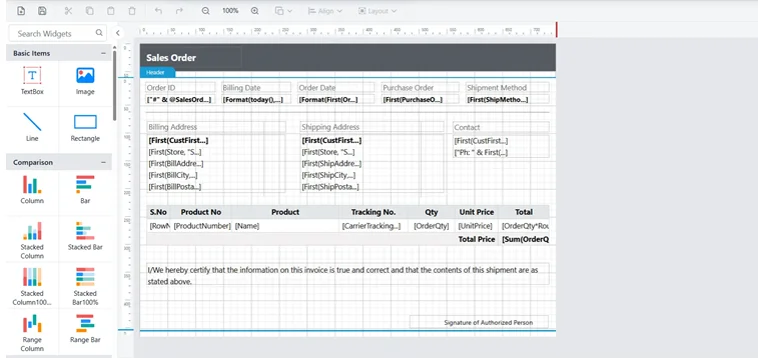
In the first stage, IT owned reporting end to end. Reports were requested through a central team, built in banded designers such as Crystal Reports and SSRS, and served from a dedicated report server. Control improved, but backlogs and report sprawl followed. Reports defined in a documented format such as RDL outlived the servers that rendered them.
What changed: As relational databases and client-server computing replaced mainframe batch printing, reporting moved to visual, banded report designers such as Crystal Reports. Microsoft released SQL Server Reporting Services (SSRS) in January 2004, defining reports in Report Definition Language (RDL), a published XML schema.
Why it changed: SQL made data queryable beyond application programmers, and regulation raised the stakes on accuracy. Section 404 of the Sarbanes-Oxley Act of 2002 required management to assess internal controls over financial reporting, making report correctness an audit concern.
Impact on software teams: Reporting became centralized and IT-owned, and the cost showed up as a queue: thousands of near-duplicate reports, each built for a single request.
Why it matters today: Many enterprises still run large RDL estates, so format compatibility and migration paths remain real buying criteria. The deeper lesson is that declarative report definitions outlive the servers that rendered them. A report defined in a portable, documented format is an asset. A report hard-coded into application logic is a liability. Microsoft states that starting with SQL Server 2025, it will not release new versions of SQL Server Reporting Services (SSRS) and that Power BI Report Server (PBIRS) will become the default on-premises reporting solution for SQL Server. SSRS 2022 will continue to receive security updates and support through January 11, 2033. Leaders should ask whether their report definitions can move when their infrastructure does.
Evolution stage 2: How did reporting move inside the application?
Reporting moved from separate portals into the application itself. Viewer controls such as Microsoft’s ReportViewer, shipped with Visual Studio 2005, let developers render reports on application screens. Embedding the viewer didn't embed the capability, though: developers kept authoring, scheduling, security, and export logic as custom code.
What changed: Viewer controls such as Microsoft’s ReportViewer for Windows Forms and ASP.NET let developers render reports inside application screens, in the context of the record or workflow a user was handling. Microsoft distributed the ReportViewer controls as a data control in Visual Studio 2005. Embedding interfaces also changed over the following years: Eckerson Group’s 2016 analysis for TDWI traced them from client/server libraries such as COM to web interfaces such as SOAP and iFrames to JavaScript and REST.
Why it changed: Users resisted switching tools. A manager reviewing an account wanted its report on that screen, not in a separate portal. Independent software vendors also saw that reports carrying their own brand reinforced their product’s value. Mature .NET and Java component ecosystems and the move to browser-based applications made this practical.
Impact on software teams: Every new report became an engineering ticket tied to the release cycle. Teams often wrote scheduling, security, and export logic by hand, application by application. Self-service authoring, which would remove that ticket queue, arrived later and is covered under stage 6.
What to watch for today: Teams still repeat this pattern. They embed a viewer, declare reporting done, and later discover that authoring, distribution, and access control have become custom code they must maintain indefinitely. This is reporting debt, and it compounds. Evaluate the full lifecycle of a report, from authoring to retirement.
Evolution stage 3: How did SaaS change embedded reporting?
SaaS put many customers on one deployment, so reporting had to enforce tenant isolation across data, report definitions, branding, and permissions. Customer-facing reporting also became part of the product interface. Security became the defining requirement, because one missing tenant filter in a dataset exposes one customer’s records to another.
What changed: NIST’s definition of cloud computing (SP 800-145, published September 2011) describes this as resource pooling in a multi-tenant model. Customer-facing reporting became part of the product’s interface, and reports had to carry each tenant’s data, branding, and permissions without crossing tenant boundaries.
Why it changed: Subscription economics shifted operational responsibility to the vendor. One tenant’s heavy query could degrade performance for every other tenant, a pattern Microsoft documents as the Noisy Neighbor antipattern. Because the Azure Architecture Center’s tenancy model guidance offers no single correct design, from shared databases to database-per-tenant, the reporting layer had to adapt to whatever model the application chose.
Impact on software teams: Vendors needed row-level filtering, per-tenant data source resolution, per-tenant theming, and controlled self-service so customers could build reports without seeing anyone else’s data. OWASP ranks Broken Access Control as the top web application risk in both its 2021 and 2025 Top 10 lists. In multi-tenant reporting, one missing tenant filter in a dataset is a cross-tenant data exposure.
The question to ask today: The tenant boundary is the most consequential line in any SaaS reporting architecture. Ask one question of every embedded reporting solution: is isolation enforced by the platform, or does it depend on every developer remembering to add a filter? For how these requirements play out in practice, see embedded reporting for SaaS and multi-tenant embedded reporting.
Evolution stage 4: How did cloud-native architecture change reporting engines?
Cloud-native architecture replaced the monolithic report server with containerized services that scale horizontally and expose functionality through APIs. Reporting load follows customer calendars, such as month-end close and payroll runs, so capacity had to match those peaks. Data residency commitments also meant reporting had to run in specific regions.
What changed: Principles popularized by The Twelve-Factor App, such as stateless, disposable processes and configuration taken from the environment, applied to reporting engines as much as to any other service.
Why it changed: A report server sized for peaks sits idle between peaks, and one sized for averages struggles at the peak. Container orchestration, with Kubernetes graduating as a Cloud Native Computing Foundation project in 2018, made it practical to match capacity to those peaks.
Impact on software teams: The reporting engine had to run where the application runs, in the same cluster and region, behind the same gateways, monitored by the same observability tooling. Long-running exports moved to asynchronous queues. Reporting became one more service in the architecture rather than a server off to the side.
Why it matters today: A reporting component that only runs as a monolith becomes the constraint on the whole architecture. It dictates where you can deploy, how you scale, and whether you can honor a customer’s residency requirement. Treat deployment flexibility as a first-order criterion for any enterprise reporting platform.
Evolution stage 5: Why did compliance reshape embedded reporting?
Compliance turned reports into evidence. GDPR, the HIPAA Security Rule, SOC 2 examinations, and DORA pushed platforms to provide audit trails, version history for report definitions, enterprise identity integration, data masking, and controls on scheduled distribution, because every export is a point where data leaves the application’s security perimeter.
What changed: Auditors, regulators, and customers’ compliance teams began relying on reports to prove that controls work and operations run as described. Operational reporting, the daily visibility into orders, claims, shipments, incidents, and service levels, became how organizations demonstrate control.
Why it changed: The GDPR, applicable since 2018, gives individuals a right of access to their personal data (Article 15). The HIPAA Security Rule requires audit controls that record activity in systems containing electronic protected health information. SOC 2 examinations evaluate a vendor’s controls against the AICPA Trust Services Criteria, and the EU’s Digital Operational Resilience Act (DORA) has applied to financial entities since January 2025.
Impact on software teams: Reporting platforms need audit trails for who viewed, exported, or scheduled which report; version history for report definitions; integration with enterprise identity providers via SAML or OpenID Connect; data masking; and controls over scheduled distribution. Every export button is a data egress point. A report emailed as a PDF leaves the application’s security perimeter permanently.
Why it matters today: Reporting and export controls belong in the same review as the rest of the application. For a sector example, see the benefits of embedded reporting in healthcare. Design governance into the reporting layer, not after the first audit finding.
Evolution stage 6: Why did reporting become a product capability?
Reporting became a product capability once strong customer-facing reports became the baseline buyers compare. Product management took ownership of the reporting roadmap, and white-labeling, self-service authoring within guardrails, and accessible output became requirements. Differentiation shifted from whether reports exist to their depth, fidelity, and governance.
What changed: Reporting moved from a supporting feature to a differentiator, and then to an expected capability. In our view, early SaaS products with strong customer-facing reporting stood out, and as competitors caught up, strong reporting became the baseline buyers compare against.
Why it changed: Reports show customers a product’s value. A logistics platform’s on-time delivery report or a payroll system’s compliance summary is an artifact a buyer can show internally to justify the purchase. Reporting became part of how product value is measured.
Impact on software teams: Product management took ownership of the reporting roadmap. White-labeling, consistent UX, and self-service authoring within guardrails became requirements, and accessibility obligations followed: customer-facing reports are expected to meet WCAG 2.2 criteria wherever accessibility commitments apply, including under the European Accessibility Act since June 2025. Because strong reporting is now the baseline, differentiation shifted to depth: tenant-aware self-service, output fidelity, scheduling, governance, and performance.
Licensing and pricing: Eckerson Group’s 2016 analysis for TDWI traced embedded BI pricing from per-user licenses in the 1990s, to server-based licensing in the 2000s, to value-based pricing in the 2010s. For software vendors, the pricing model determines who bears the cost of heavy reporting loads: the vendor, the tenant, or the platform.
The build-versus-buy implication: This shift reframes the build-versus-buy decision. Decide on total cost, not license cost: building in-house means owning rendering, pagination, export fidelity, scheduling, tenant isolation, and audit logging indefinitely, and every engineering hour spent on a homegrown report engine is an hour not spent on the product’s core domain. Ask whether reporting is where your product differentiates, or where it simply must be excellent and dependable. For a deeper discussion, see our guide to building versus buying embedded reporting in 2026. The features SaaS teams look for in an embedded reporting tool show what a mature solution typically includes.
Evolution stage 7: How are AI and automation changing reporting workflows?
AI and automation are entering reporting workflows through natural-language requests, assisted query and layout authoring, generated summaries, and agents that request reports via APIs. The governance problem stays constant: a generated query must respect the same tenant isolation and row-level security as a hand-built one, and a generated summary must trace to the underlying data.
What changed: Reporting workflows are absorbing automation: natural language requests that produce report drafts, assisted query and layout authoring, generated narrative summaries, event-triggered distribution, and software agents requesting reports through APIs. Open protocols such as the Model Context Protocol (introduced in November 2024) are standardizing how AI agents connect to application tools and data.
Why it changed: Large language models lowered the cost of translating intent into queries and layouts, and organizations began automating multi-step workflows end to end. Reports are natural inputs and outputs for those workflows.
Impact on software teams: AI adds a governance problem. Generated output must inherit the same controls as hand-built output. The NIST AI Risk Management Framework emphasizes validity, accountability, and transparency, all of which apply directly to AI-generated reporting.
Why it matters today: AI makes the deterministic, governed report more valuable, not less. When an agent or generated summary makes a claim, auditors, customers, and the agents themselves verify it against the governed report. Accept AI reporting features only when they inherit the platform’s security model rather than bypass it. This section describes where the industry is heading, not any one product's features.
Which stage of embedded reporting is your team in today?
Most teams run several stages at once. Match the symptom you feel most often to a stage below, then run the check in the right-hand column. The stage tells you which stakeholder is pushing on reporting, and the check tells you whether your platform can answer them.
| Symptom you feel | Stage | First check to run |
|---|---|---|
| Hundreds of near-duplicate reports pile up on an aging report server | 1 | Can you import report definitions elsewhere without rebuilding them? |
| Every new report is an engineering ticket tied to a release | 2 | Can authoring happen without a product deployment? |
| Onboarding a customer means copying reports or editing data sources by hand | 3 | Does the platform enforce tenant isolation, or does each report’s filter? |
| Month-end load slows the application, or the reporting server idles between peaks | 4 | Can rendering and scheduling scale independently of the application? |
| A customer’s security review asks who exported what, and when | 5 | Can you produce an audit log of views, exports, and schedules? |
| Sales needs white-labeled, accessible reports to close deals | 6 | Do the viewer, designer, emails, and exports all take your branding? |
| Someone wants an assistant or agent to request reports | 7 | Does every automated run inherit the requesting user’s permissions and get logged? |
What do enterprise buyers expect from an embedded reporting platform?
Treat an embedded reporting platform like any other infrastructure component and evaluate it against the expectations below. They reflect the cumulative effect of all seven stages, each with a way to verify it during an evaluation.
| # | Expectation | What good looks like | How to verify | Stage that created it |
|---|---|---|---|---|
| 1 | Tenant isolation | Tenant scope enforced at the data layer for views, exports, schedules, and caches. | Attempt a cross-tenant parameter change in a test environment. | Stage 3 |
| 2 | Security and identity | Token-based embedding using the application’s own identity provider. | Confirm no parallel user store is required. | Stages 3 and 5 |
| 3 | Governance | Role-based and row-level permissions, audit logs, and report version history. | Ask for a sample audit log of report views and exports. | Stage 5 |
| 4 | Deployment flexibility | Runs in containers, cloud, or on-premises to match data residency needs. | Deploy it in your own pipeline during evaluation. | Stage 4 |
| 5 | Scalability | Rendering and scheduling scale independently of the application. | Load test month-end batch scenarios. | Stage 4 |
| 6 | Report fidelity | Pixel-accurate, paginated output across PDF, Excel, Word, and print. | Render your most complex existing report. | Stage 1 |
| 7 | Portability | Support for a published, documented report definition format such as RDL to protect existing investment. | Import existing report definitions without rebuilding. | Stage 1 |
| 8 | Self-service | Customers build and modify reports within governed datasets. | Have a non-developer build a report in under an hour. | Stage 6 |
| 9 | White labeling | Full rebranding of viewer, designer, and delivered output. | Check emails, exports, and error states, not just the viewer. | Stage 6 |
| 10 | Automation and APIs | APIs for provisioning tenants, users, permissions, and schedules. | Script a full tenant onboarding. | Stages 4 and 7 |
The common thread is that operational reporting must behave like the rest of the production stack: observable, governed, automatable, and predictable under load.
Strategic framework: How embedded reporting platforms moved from feature to platform
Across five dimensions, embedded reporting moved from something an application has to something an application runs on.
| Dimension | Reporting as a feature (Stages 1 to 2) | Reporting as a platform capability (Stages 3 to 7) |
|---|---|---|
| Architecture | Central report server or report files bundled in the application; scales with the server | Independent, containerized services for rendering, scheduling, and data access; scales per workload |
| User expectations | Internal users accept fixed layouts and IT request queues | Customers, partners, auditors, and AI agents expect self-service, branded, on-demand reports |
| Governance | Firewall is the security boundary; access managed by IT | Tenant isolation, row-level security, audit trails, and version history enforced in the reporting layer |
| Scalability | Sized for one organization’s reporting load | Sized for thousands of tenants with uneven, bursty demand |
| Product strategy | A cost of delivery, built late in the roadmap | A packaged, priced, and measured capability that supports sales and renewals |
The shift happened because stages 3 to 6 each added a stakeholder with a say in reporting. SaaS added the tenant. Cloud-native added the platform engineering team. Regulation added the auditor. Commercial competition added the buyer’s procurement team. Once reporting had to satisfy all of them, it could no longer be built as a feature.
What should technology leaders learn from the evolution of embedded reporting platforms?
Judge any embedded reporting platform with four questions, because features converge while terms do not: where rendering runs and who patches it, which format reports live in and who else can read it, how one customer’s data and reports are kept apart from another’s, and what leaving costs, in a sentence you could say aloud.
- Where does rendering run, and who deploys and patches it? This decides where you can deploy, how you scale, and whether you can honor a residency requirement (stage 4).
- Which format do the reports live in, and who else can read it? A documented format such as RDL means reports can move when infrastructure or vendors change (stages 1 and 7).
- How does the platform keep one customer’s reports and data apart from another’s? Keep tenant scope and row-level permissions in the reporting engine’s data access layer, so a new report, a new export format, or an AI agent cannot bypass them (stage 3). Choose the isolation model before the first tenant, because moving from a shared engine to dedicated instances later is a migration project.
- What does leaving cost, in a sentence you could say aloud? If the answer is "rebuild every report," that is the real price of the platform.
None of the four asks about charts. Features will keep improving whichever platform you choose. Terms are different: vendors change them on their own schedule. Microsoft’s announcement that SQL Server 2025 gets no new SSRS release, with Power BI Report Server as the default, is a recent example. Teams whose reports lived in a documented format such as RDL had something to carry forward. Teams whose logic was buried in application code did not. The portable asset is the report definition, and the most valuable thing a platform can offer beyond rendering is a documented way out. For a vendor-by-vendor view, see how embedded reporting tools compare; for details on the Microsoft transition, see the SSRS migration guide for SQL Server 2025.
Three operating decisions follow from the stages:
- Give reporting an owner. Treat it as a platform layer with a product manager and an architect, not as screens each feature team builds alone. Track usage, failure rate, and render time per tenant, and let plans toggle reporting capabilities per tenant so reporting can support pricing.
- Separate report authoring from application releases. A new report should ship without a product deployment.
- Govern AI before shipping it. Require that AI-assisted report authoring produces reviewable definitions and that every automated report run inherits the requesting user’s permissions and is logged.
One caution applies: not every product needs a platform. A single internal application with a handful of reports may be well served by a simple component. The task is to notice the day requirements outgrow the feature.
Bold Reports is an embedded, paginated reporting platform built on RDL, with a Report Viewer, Designer, Writer, and Server. Test the four questions on your own reports. Start a 30-day free trial of Bold Reports, import an existing RDL file, and render your most complex paginated report.
What will test embedded reporting next?
In our view, three pressures come next. Software agents will request reports through APIs, which makes the report a governed data contract: versioned, permission-aware, and machine-readable. Buyers will ask for proof of reporting controls in due diligence, the way they already ask for proof of encryption. Differentiation will shift from producing reports to producing trust: provable isolation, traceable figures, and output that holds up under audit.
Teams that treat reporting as infrastructure with an owner find the next security review routine. Teams that treat it as a feature see it as a delay in their next enterprise deal.
Frequently asked questions
- 1.
How have embedded reporting platforms evolved?
Embedded reporting platforms evolved through seven stages: IT-owned report servers, in-app viewers, multi-tenant SaaS reporting, cloud-native services, governance and compliance tooling, a product-level capability, and AI-assisted workflows. Each stage followed a change in how software is delivered or regulated, and stages 3 to 6 each added a stakeholder with a say in reporting: the tenant, platform team, auditor, and buyer.
- 2.
What is the difference between embedded reporting and BI?
Embedded reporting delivers known, repeatable outputs, such as invoices, statements, and operational reports, inside an application, with a precise layout and controlled distribution. BI supports open-ended exploration of data by analysts. Embedded reporting prioritizes accuracy, pagination, and governance for end customers, while BI prioritizes flexibility for people asking new questions.
- 3.
Why is multi-tenancy critical for SaaS reporting?
Many customers share one deployment, so the reporting layer must guarantee each tenant sees only its own data, reports, and branding. A single missing tenant filter in a dataset can expose one customer’s records to another. Enforcing isolation at the platform level, rather than in each report, removes the need to rely on individual developers remembering the filter.
- 4.
Why is reporting now a platform capability rather than a feature?
Reports now serve as audit evidence, proof of customer value, and inputs to automated workflows. Meeting those roles requires centralized security, governance, scalability, and lifecycle management. A single feature built by one team cannot provide those, so reporting is better owned and run as a platform layer with its own roadmap and service level.
- 5.
What should CTOs evaluate in an embedded reporting solution?
Evaluate where rendering runs, whether the platform enforces tenant isolation, which report format stays portable, and what leaving costs. Then check pixel-accurate output across PDF, Excel, and Word; audit trails; governed self-service; deployment flexibility; and whether any AI feature inherits the existing security model rather than bypassing it.
- 6.
How is AI changing embedded reporting?
AI is speeding up report authoring, summarization, and automated delivery. It also raises the bar for governance: a generated query must respect the same tenant isolation and row-level security as a hand-built one, and a generated summary must trace to the underlying data. Governed, deterministic reports remain what generated content is verified against.