
Why Power BI Paginated Reports Slow Down at Scale

TL;DR
Power BI paginated reports can become slow at scale due to rendering bottlenecks, large datasets, concurrent exports, Power BI Premium capacity throttling, inefficient queries, and gateway limitations. Improve paginated report performance using query optimization, workload isolation, capacity planning, export scheduling, and scalable reporting architecture.
Introduction
Power BI paginated reports can support both mid-sized and enterprise reporting workloads, but large-scale deployments may encounter performance and operational challenges depending on workload patterns, capacity configuration, report complexity, and infrastructure architecture.
Organizations running high-volume reporting workloads may experience rendering delays, export latency, capacity contention, gateway throughput limitations, memory pressure, or query timeouts when generating large volumes of PDFs, invoices, operational reports, and scheduled exports concurrently. In some cases, organizations evaluating these challenges also consider alternative reporting platforms like Bold Reports®, which are designed for high-volume and scalable reporting scenarios.
Power BI paginated reports remain widely used for operational and pixel-perfect reporting because of their strong document formatting capabilities, export support, and integration within the Microsoft ecosystem.
This article examines common Power BI paginated report scalability challenges, their potential root causes, and the strategies organizations use to optimize large-scale reporting workloads.
What are Power BI paginated reports?
Power BI paginated reports are pixel-perfect, print-ready reports built on SQL Server Reporting Services (SSRS) technology and integrated into the Microsoft Power BI ecosystem. Enterprises commonly use them for invoices, financial statements, regulatory reporting, operational reporting, customer-facing PDFs, Excel exports, and large tabular datasets.
Unlike interactive dashboards, paginated reports are optimized for precise formatting, high-volume exports, and scheduled document generation, creating significantly different performance and infrastructure demands at scale.
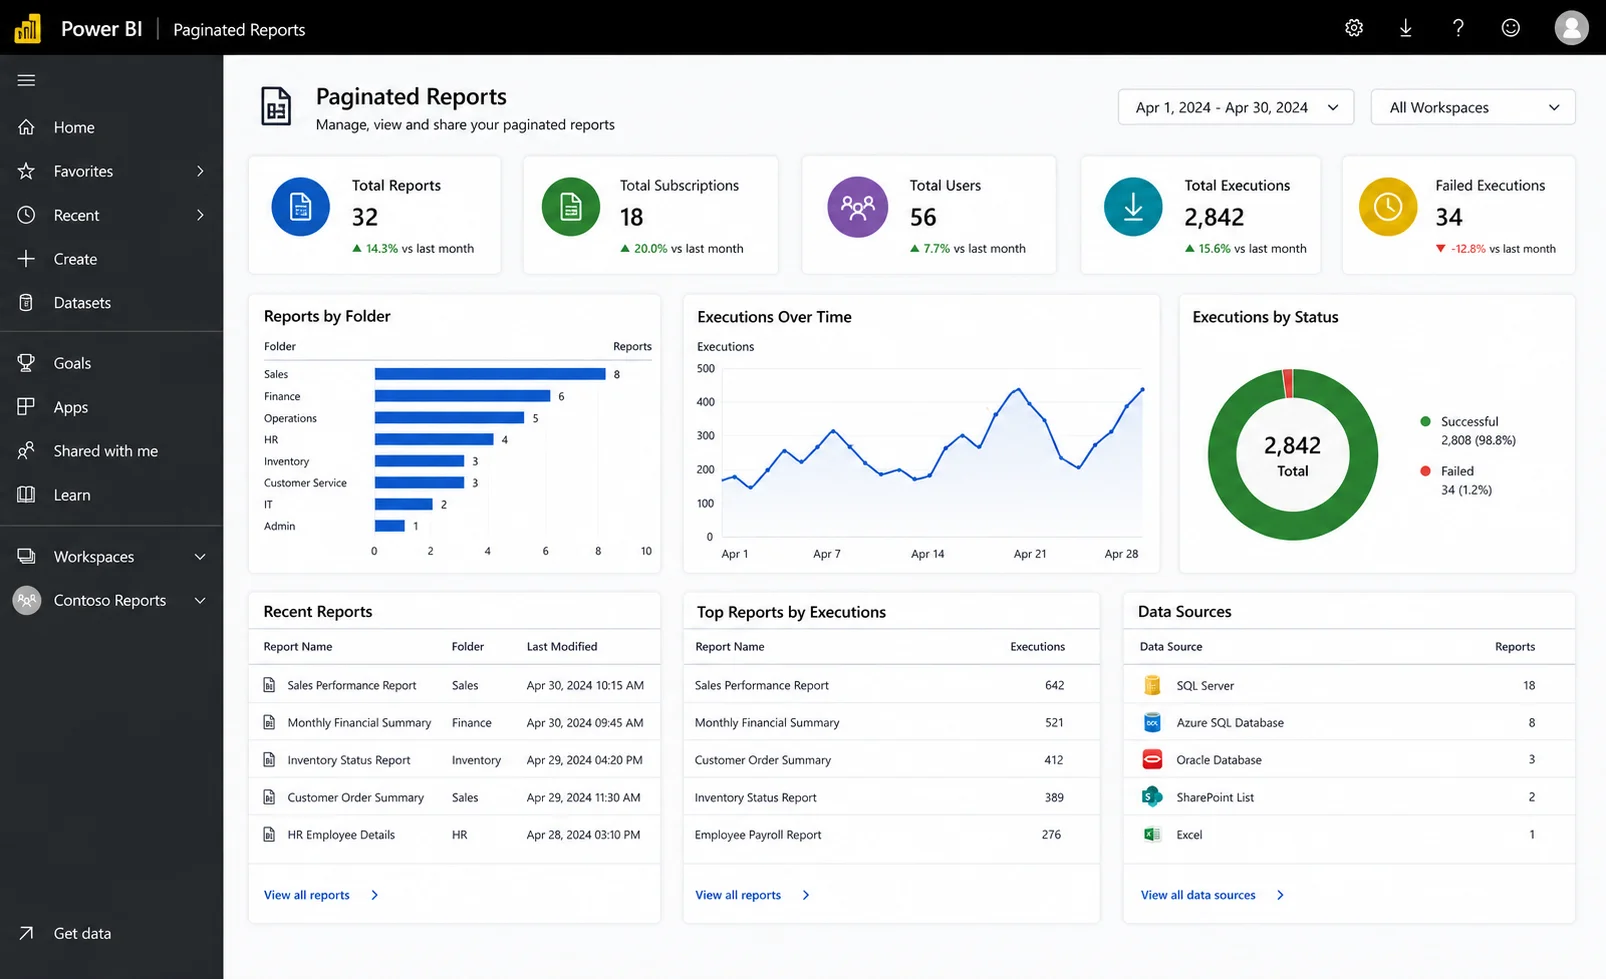
What causes Power BI paginated reports to slow down?
In high-volume enterprise environments, performance issues in Power BI paginated reports usually stem from a combination of rendering, data processing, infrastructure, and concurrency factors.
-
- Rendering and export overhead: Complex report layouts, large PDF or Excel exports, and memory-intensive document generation can significantly increase processing time, especially when reports are heavily formatted or include images and subreports.
- Large datasets and inefficient queries: Reports that process large row-level datasets, wide tables, or unoptimized queries often experience longer execution times, higher memory usage, and increased likelihood of timeouts.
- Concurrency and export workloads: High volumes of concurrent report requests, subscription bursts, and large-scale export operations can overload system resources and create delays in report generation and delivery.
- Capacity and infrastructure constraints: Premium capacity limitations, gateway latency, and network dependencies can introduce bottlenecks, particularly in shared or hybrid environments with heavy workloads.
As reporting volumes increase, paginated reporting workloads begin to resemble enterprise document-processing systems rather than traditional BI dashboards, due to their intensive rendering, scheduling, and export requirements.
Common enterprise reporting workloads
Many teams underestimate what “scale” means in reporting systems. A single report viewed by one analyst is relatively easy to support. Enterprise environments, however, typically involve much larger and more complex workloads.
Enterprise-scale reporting workloads may include:
-
- 20,000+ invoice PDFs generated overnight.
- Thousands of concurrent report exports.
- Multiregion reporting workloads.
- High-volume subscription schedules.
- Embedded customer-facing reporting portals.
- Large operational datasets.
- Concurrent PDF and Excel generation.
At this scale, paginated reports behave less like lightweight BI assets and more like resource-intensive document rendering workloads. Microsoft documentation also highlights scalability and performance considerations for paginated reports running within Power BI and Fabric service environments.
1. Rendering and export performance bottlenecks
Rendering can become a significant performance consideration in Power BI paginated reports, particularly in environments that generate large PDF exports, Excel files, print-ready operational documents, or high volumes of scheduled reports.
Even when underlying queries execute efficiently, large export workloads may increase CPU, memory, and capacity utilization depending on report complexity, formatting requirements, document size, and concurrency levels. Because paginated reports are designed for fixed-layout document generation, high-volume exports may require substantially more processing than interactive dashboard-style reports.
Common rendering challenges
| Rendering challenge | Potential performance impact |
| Complex tablix layouts and extensive formatting | May increase export and rendering duration |
| Large PDF and Excel exports | May increase infrastructure resource utilization |
| Extensive subreport usage | May increase dataset execution and processing overhead |
| Embedded images and visual assets | May increase rendering time and export size |
| High-cardinality datasets | May increase export latency and rendering workload |
Enterprise optimization strategies
Organizations often improve rendering performance through layout optimization, dataset reduction, export scheduling, pagination tuning, and workload distribution across Power BI Premium or Fabric capacities where applicable. Without appropriate optimization and capacity planning, concurrent exports and large-scale document generation workloads may affect scalability, workload performance, and overall user experience.
2. Power BI Premium capacity and concurrency challenges
Power BI paginated reports can increase infrastructure and capacity demands in enterprise environments with high concurrency, large exports, or heavy subscription-based reporting workloads. As reporting volumes grow, some organizations may encounter export delays, slower report execution, subscription queueing, or timeout-related issues depending on report complexity and capacity configuration.
Why capacity constraints occur
Paginated reports require query execution, rendering, document generation, and export formatting as part of the export process. Large PDF and Excel exports can further increase processing requirements, particularly during concurrent workloads. In shared Power BI Premium or Fabric environments, high-volume export activity may contribute to workload contention during peak usage periods.
Common concurrency challenges
| Challenge | Potential business impact |
| Concurrent PDF and Excel exports | May increase rendering and execution time |
| Shared Power BI Premium capacities | May contribute to workload contention |
| Subscription bursts | May increase export queue duration |
| Large datasets and complex layouts | May increase processing requirements |
| Multiregion usage | May increase peak-hour capacity utilization |
Enterprise optimization strategies
Organizations often improve scalability through workload isolation, staggered subscription scheduling, export governance policies, capacity monitoring, query optimization, and dedicated reporting capacities where needed. Without appropriate workload planning and capacity governance, large-scale export operations may affect reporting scalability, shared workload performance, and overall user experience.
3. Large dataset processing challenges
Large datasets can create scalability challenges in Power BI paginated reports, particularly for transaction-level reporting, compliance exports, audit logs, and operational workloads. As data volumes grow, organizations may encounter longer export times, rendering delays, higher memory utilization, and query timeout-related issues. Because paginated reports generate detailed fixed-layout documents, large row-level exports can substantially increase processing demands.
Common large dataset challenges
| Challenge | Potential impact |
| Massive row-level datasets | Longer rendering and export times |
| Wide tables with excessive columns | Higher memory utilization |
| Large Excel and PDF exports | Increased processing overhead |
| Complex queries on large models | Query and execution delays |
| Unfiltered report execution | Unnecessary workload activity |
Enterprise optimization strategies
Most performance issues are resolved by fixing inefficient queries, reducing dataset size, and eliminating unnecessary joins. Reducing unnecessary rows and columns helps improve export performance while lowering memory and rendering overhead.

4. Query performance and data retrieval bottlenecks
Query design can significantly affect Power BI paginated report performance, particularly when processing large enterprise datasets.
Factors that may affect performance include excessive joins, inefficient DAX calculations, missing indexes, over-fetching columns, non-parameterized queries, and redundant dataset processing. Under high concurrency, these inefficiencies may increase query execution time and infrastructure utilization.
Common query performance challenges
| Challenge | Potential impact |
| Excessive joins and complex queries | Slower data retrieval |
| Inefficient DAX calculations | Increased processing overhead |
| Missing indexes | Longer query response times |
| Over-fetching columns | Higher memory utilization |
| Non-parameterized queries | Reduced scalability |
| Redundant dataset processing | Increased workload utilization |
Enterprise optimization strategies
Organizations typically improve performance through query optimization, dataset filtering, indexing strategies, efficient DAX calculations, parameterized queries, and preprocessing techniques. Efficient query design helps improve report responsiveness while reducing unnecessary resource utilization.
5. Gateway and hybrid infrastructure limitations
Many enterprises use gateways to connect Power BI paginated reports with on-premises data sources. As reporting workloads grow, gateway infrastructure can become a scalability constraint in hybrid environments.
Common gateway challenges
| Challenge | Potential Impact |
| Network latency | Slower report execution |
| Connection saturation | Request delays and timeouts |
| Authentication overhead | Increased processing time |
| High concurrent requests | Reduced gateway responsiveness |
| Shared gateway infrastructure | Workload contention |
Enterprise optimization strategies
Organizations typically improve gateway scalability through clustering, load balancing, infrastructure scaling, dedicated reporting gateways, and regional workload distribution. Well-designed gateway architecture helps maintain reliable paginated reporting performance across hybrid enterprise environments.
6. Monitoring and governance challenges
Large-scale Power BI paginated reporting environments require continuous monitoring and governance to maintain workload stability and capacity efficiency. Without sufficient operational visibility, organizations may struggle to identify resource-intensive reports, rendering delays, capacity saturation, export spikes, or subscription-related issues.
Key areas enterprises monitor
| Monitoring area | Operational impact |
| Capacity utilization | Helps prevent resource saturation |
| Rendering duration | Helps identify slow reports |
| Export activity | Helps detect workload spikes |
| Query execution times | Helps improve report efficiency |
| Concurrent workloads | Helps reduce workload contention |
| Gateway health | Helps maintain infrastructure stability |
Enterprise optimization strategies
Organizations typically implement capacity monitoring, workload governance, export controls, performance auditing, and proactive alerting to support reliable paginated reporting across shared environments.
Biggest misconception about paginated report scalability
A common assumption in enterprise reporting environments is that increasing Power BI Premium or Fabric capacity alone will resolve paginated report scalability issues.
While additional capacity can improve performance in some scenarios, it may not fully address factors such as inefficient queries, rendering bottlenecks, export-heavy workloads, scheduling complexity, or infrastructure constraints.
In large-scale deployments, scalability often depends on report engineering, query optimization, workload governance, capacity planning, and infrastructure architecture in addition to capacity sizing.
Best practices for scaling Power BI paginated reports
Large enterprises often improve Power BI paginated report scalability through efficient report design, workload management, and infrastructure optimization.
Key best practices
| Best practice | Potential benefit |
| Optimize report layouts | Helps reduce rendering overhead |
| Minimize dataset size | May lower memory and processing requirements |
| Improve query efficiency | Can improve report execution performance |
| Stagger subscription schedules | Helps reduce export spikes and workload contention |
| Isolate heavy workloads | May reduce shared resource contention |
| Monitor Power BI Premium capacities | Improves operational visibility |
| Optimize gateway infrastructure | Helps improve reliability and connectivity |
| Reduce unnecessary exports | Helps reduce large export workloads |
Organizations that combine optimized reports, efficient queries, and proactive capacity management are often better positioned to improve scalability and reporting performance.

Power BI paginated reports vs. SSRS at scale
Power BI paginated reports and SSRS share a similar reporting foundation but differ in deployment, scalability, and infrastructure management.
| Feature | Power BI paginated reports | SSRS |
| Deployment model | Cloud-based | Primarily self-managed |
| Power BI integration | Native | Separate |
| Capacity model | Based on Power BI Premium or Fabric | Infrastructure-managed |
| Embedded reporting | Power BI embedding support | Embedded deployment support |
| Infrastructure control | Managed environment | Greater infrastructure control |
| Customization flexibility | Power BI ecosystem capabilities | Higher deployment flexibility |
Organizations with large-scale reporting requirements may evaluate hybrid architectures or dedicated reporting platforms based on scalability, governance, and infrastructure requirements.
Why enterprises re-evaluate their reporting architecture
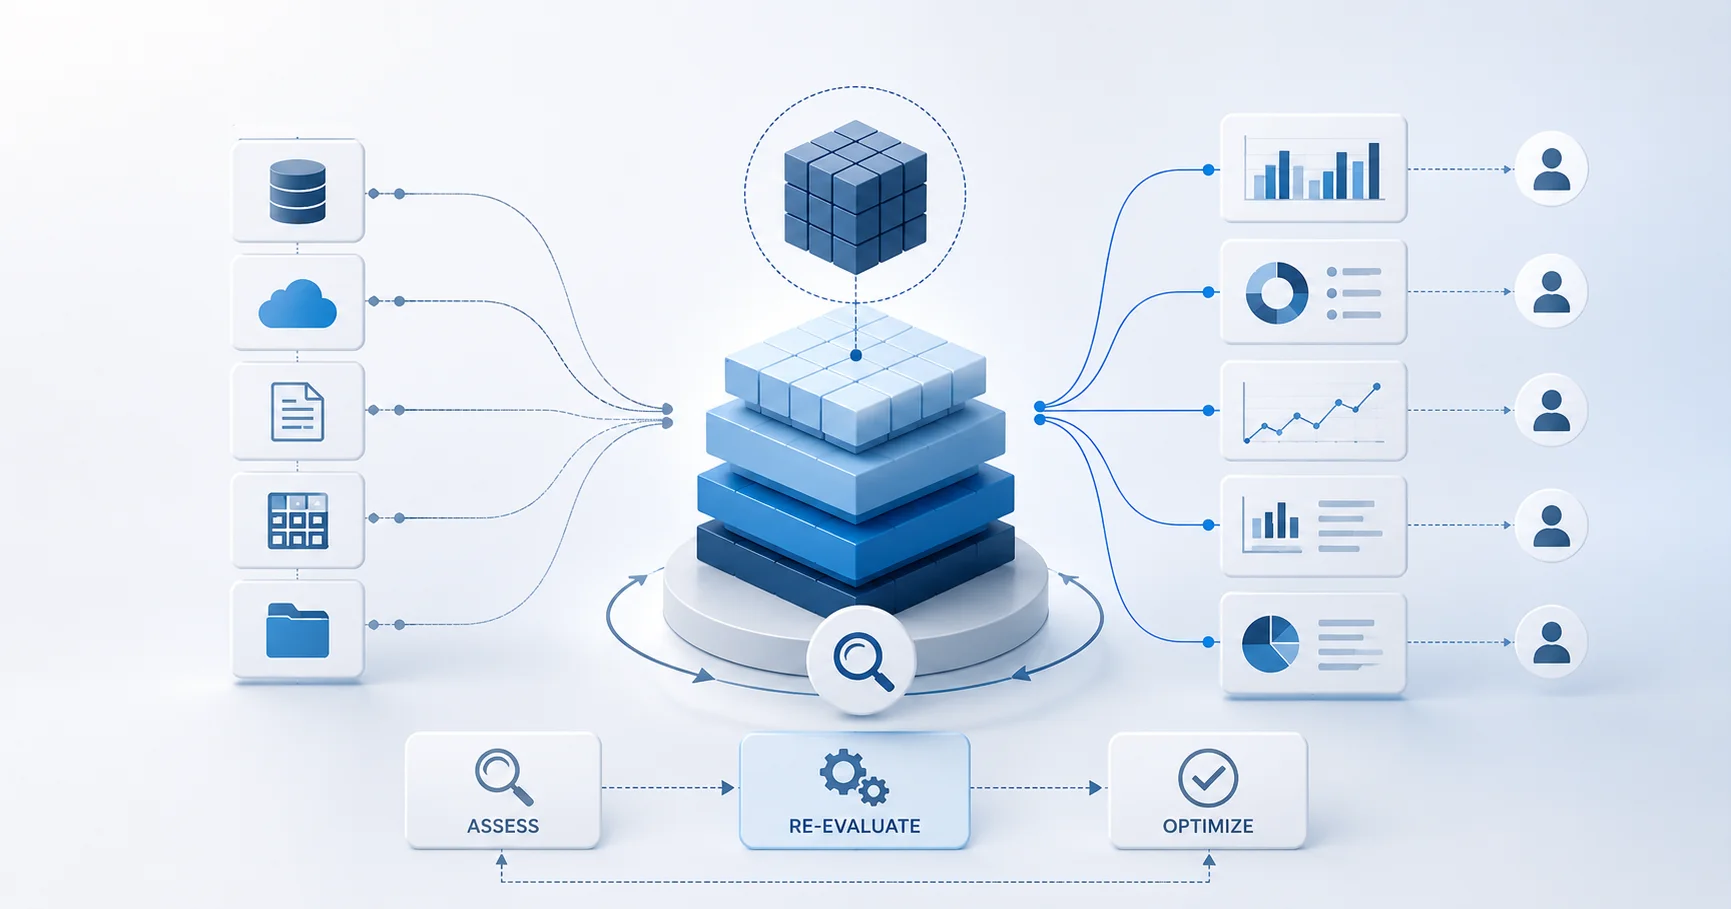
As reporting workloads scale, many organizations reach a point where performance challenges extend beyond report design into capacity limits, infrastructure constraints, and increasing concurrency demands.
This becomes especially critical for embedded analytics, customer-facing applications, and multitenant SaaS platforms, where slow report generation and scaling limitations directly impact user experience and operations.
As a result, organizations begin re-evaluating whether Power BI paginated reports can continue to meet these demands. Common challenges include handling high-volume exports, supporting multitenant architectures, and maintaining consistent performance across environments.
To address these gaps, many teams explore alternative reporting solutions that offer greater control and flexibility. Platforms like Bold Reports are designed for large-scale reporting, with dedicated rendering capabilities, strong support for embedded and multitenant scenarios, and flexible deployment across cloud, on-premises, or hybrid environments.
By adopting a more scalable reporting architecture, organizations can reduce performance bottlenecks and deliver more reliable reporting experiences as their workloads grow.
Conclusion
Power BI paginated reports are powerful for operational reporting, but performance challenges often emerge as workloads scale, especially with high concurrency, large exports, and complex infrastructure demands.
At an enterprise scale, maintaining consistent performance requires more than report design alone. It depends on efficient rendering, capacity governance, and reliable infrastructure. When these factors fall short, reporting becomes slower, less predictable, and harder to scale.
This is why many organizations re-evaluate their reporting architecture, particularly embedded reporting, high-volume exports, and multitenant SaaS environments. Solutions like Bold Reports provide greater control, scalable performance, and flexible deployment options to support these growing demands.
If your paginated reports are slowing down at scale, it may be time to modernize your approach. Schedule a demo with Bold Reports to see how you can deliver faster, more scalable, and enterprise-ready reporting experiences.
Frequently asked questions
- 1.
Are Power BI paginated reports suitable for enterprises?
Yes. Power BI paginated reports are commonly used in enterprise environments for operational reporting, financial statements, compliance documents, invoices, and customer-facing exports.
- 2.
Why can Power BI paginated reports become slow?
Performance may be affected by factors such as rendering overhead, large datasets, inefficient queries, concurrent exports, gateway constraints, or capacity-related workload contention.
- 3.
Do paginated reports require Power BI Premium or Fabric capacity?
Many enterprise deployments use Power BI Premium or Microsoft Fabric capacities to support larger workloads, higher concurrency, scheduling, and report distribution requirements.
- 4.
How can organizations improve Power BI paginated report performance?
Organizations often improve performance through query optimization, dataset reduction, efficient report layouts, staggered export scheduling, capacity governance, and gateway optimization.
- 5.
Can Power BI paginated reports handle large datasets?
Yes. Performance and scalability can vary based on query efficiency, report design, rendering complexity, and infrastructure configuration.






