Table, matrix (pivot table), list
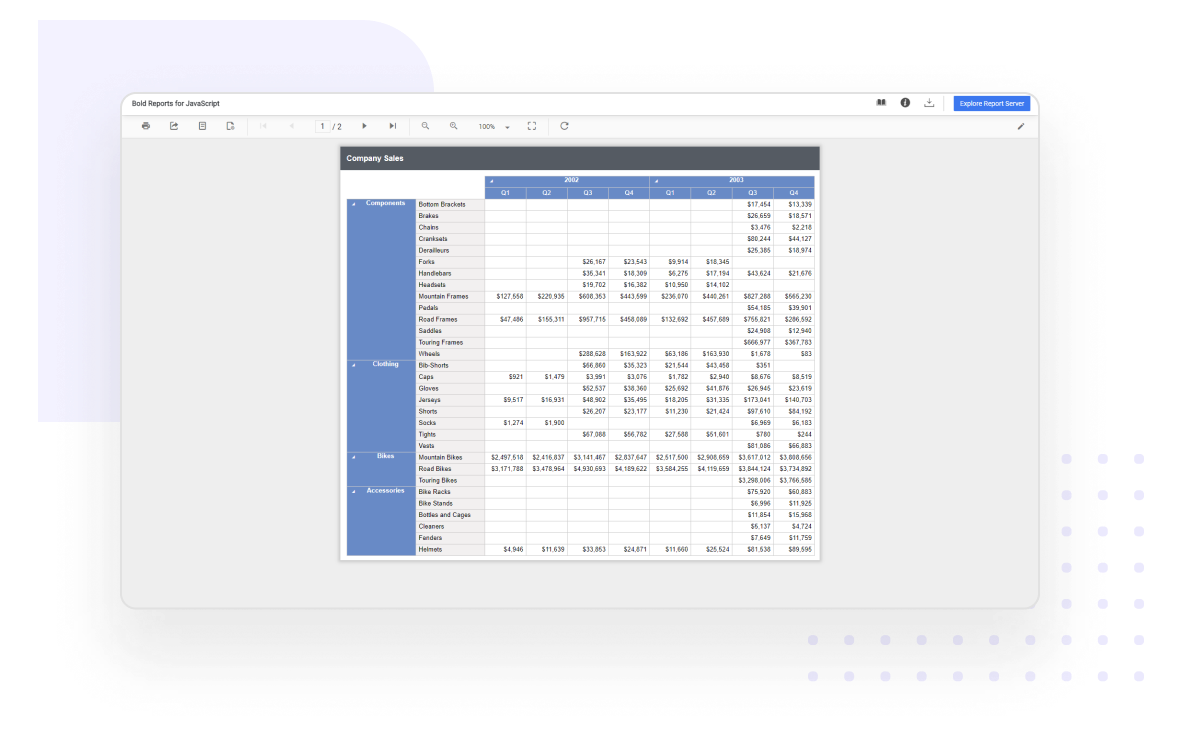
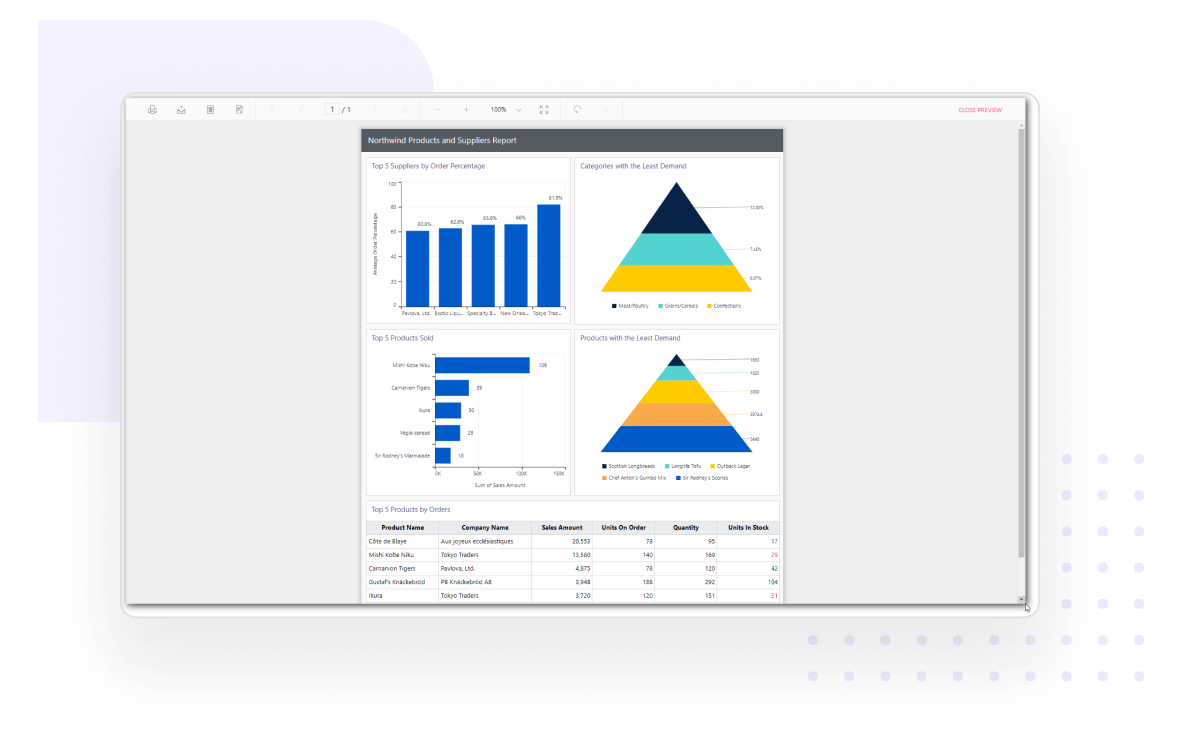
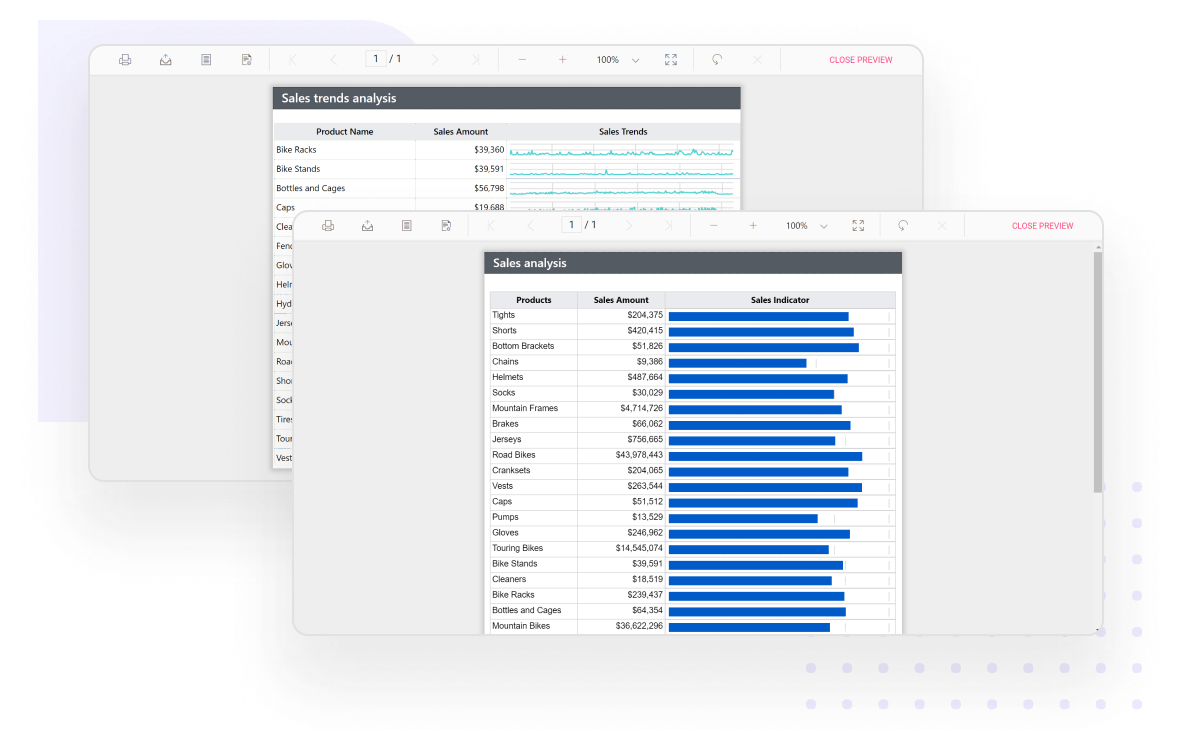
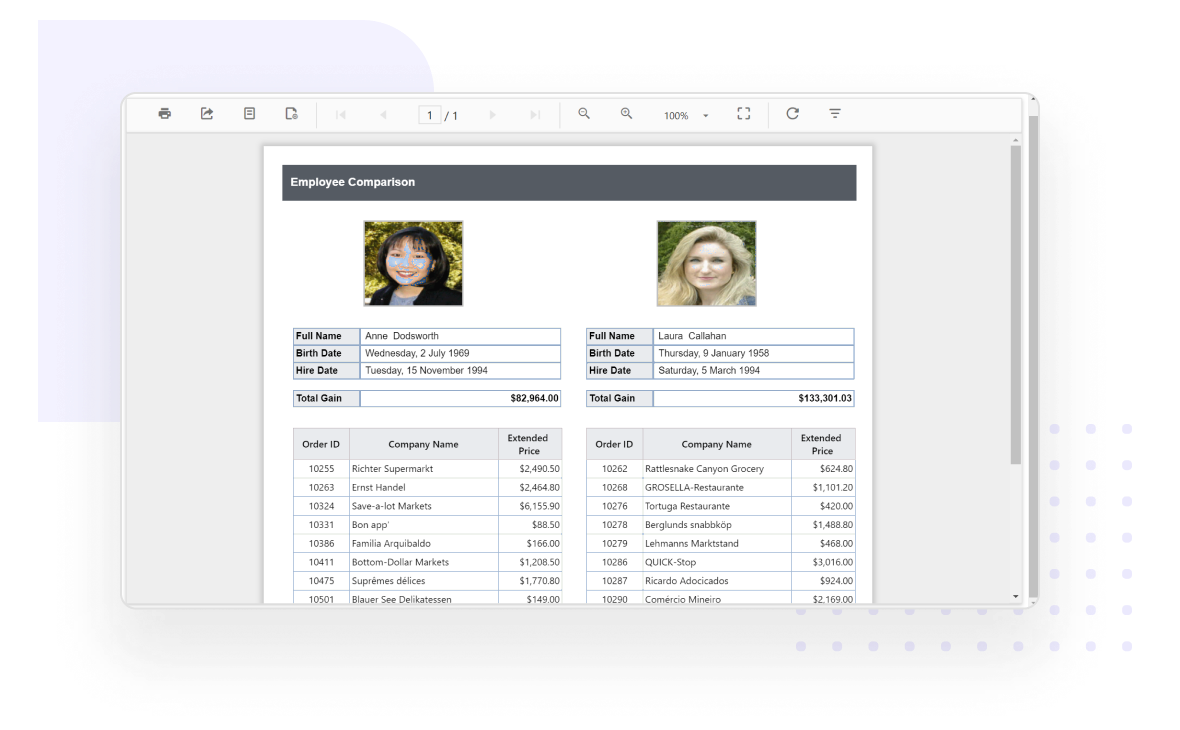
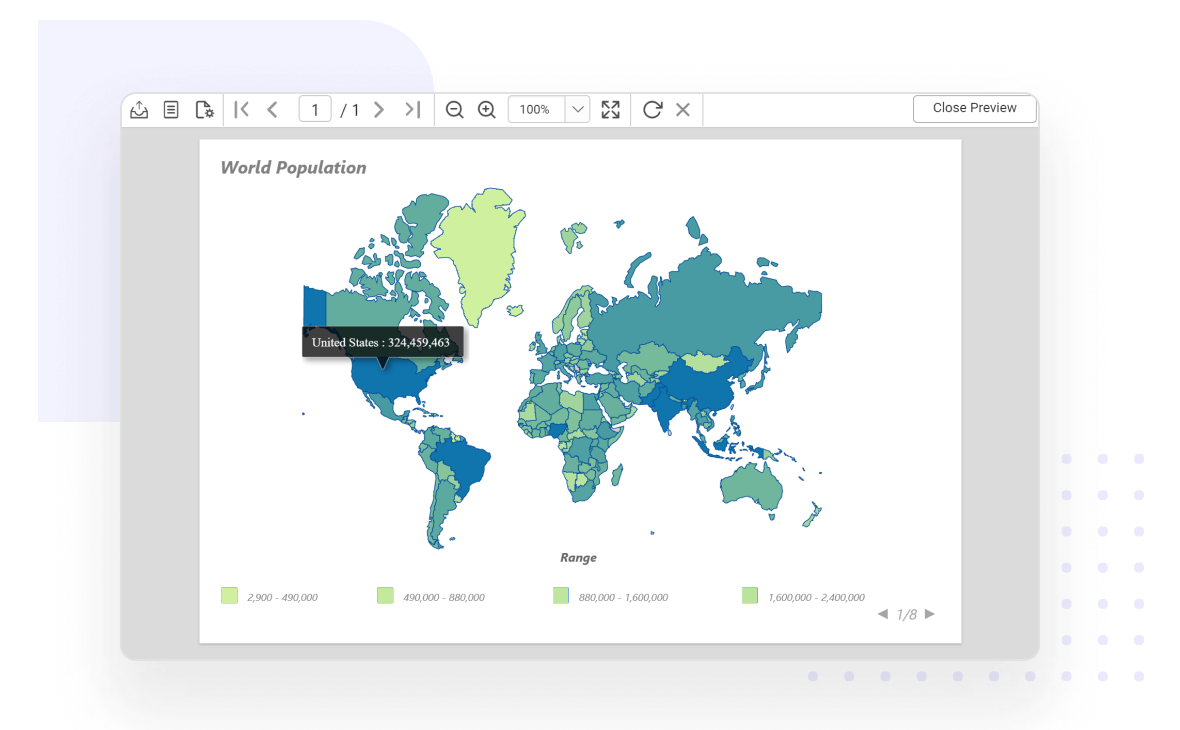
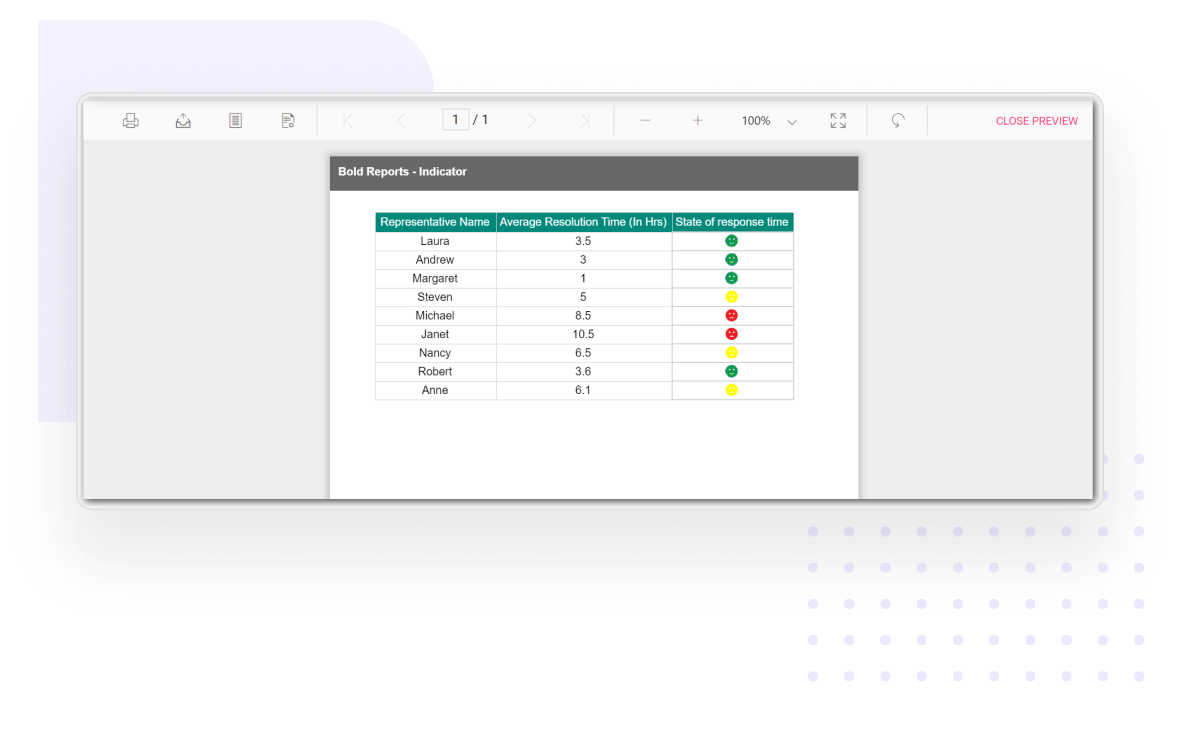
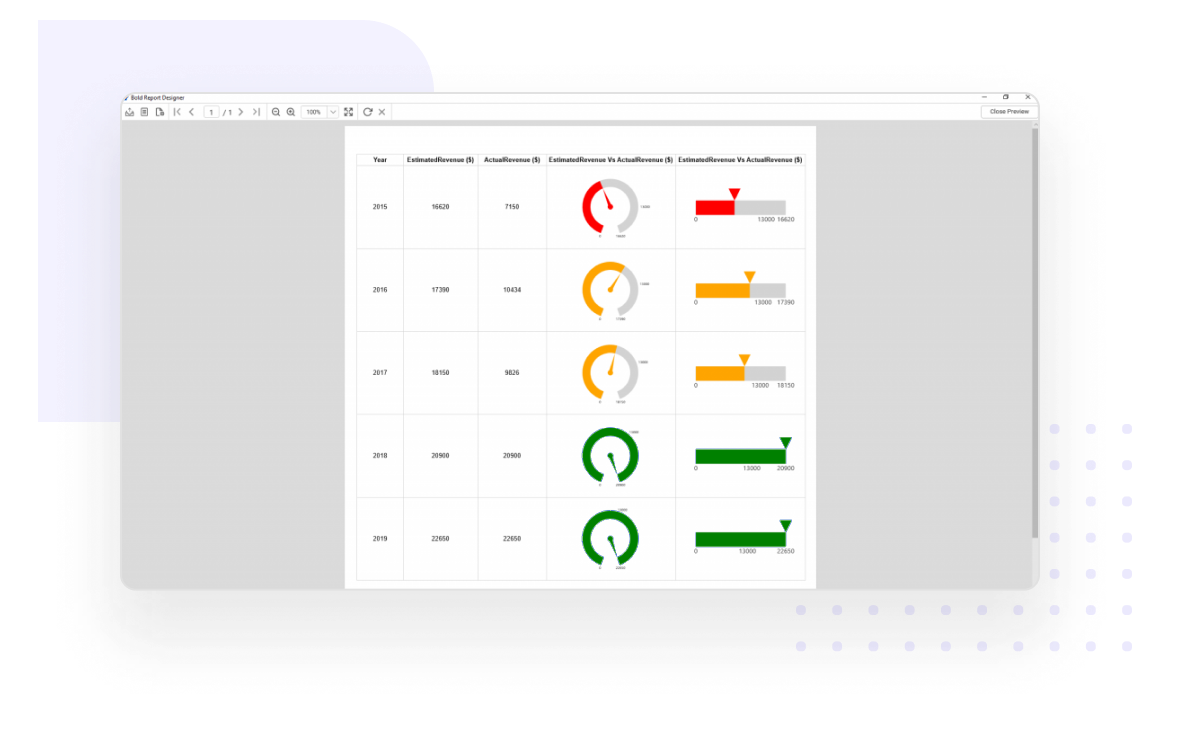
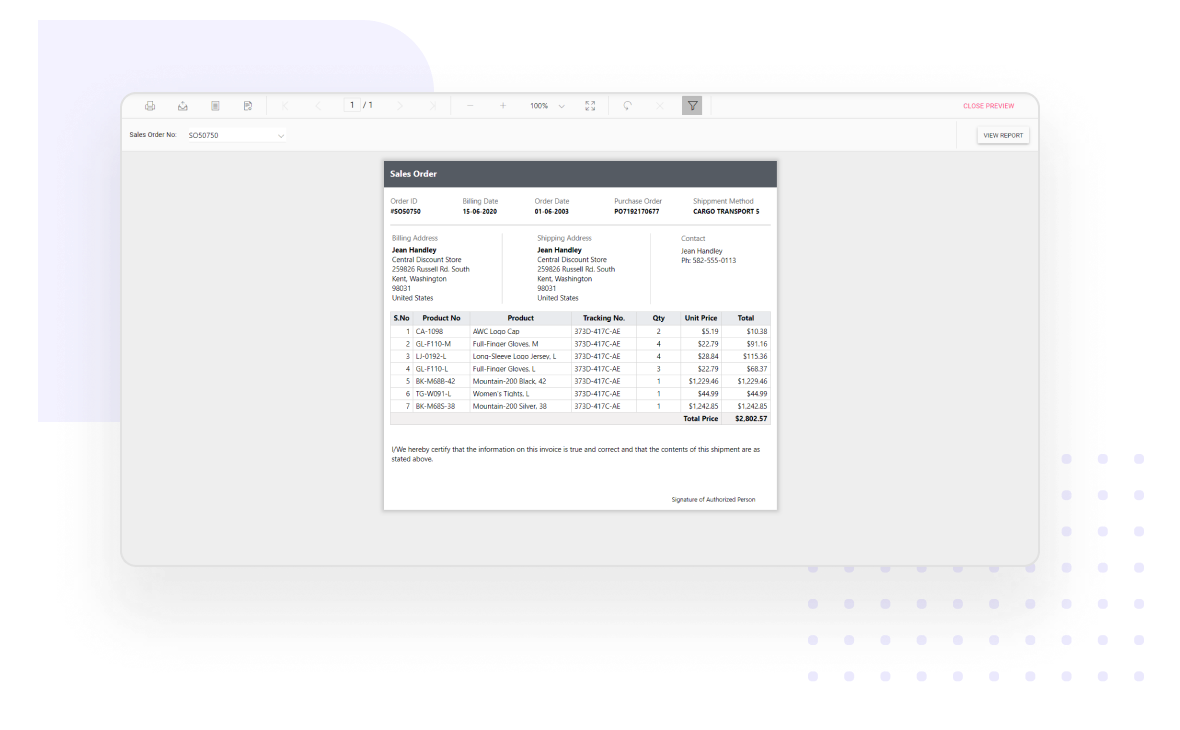
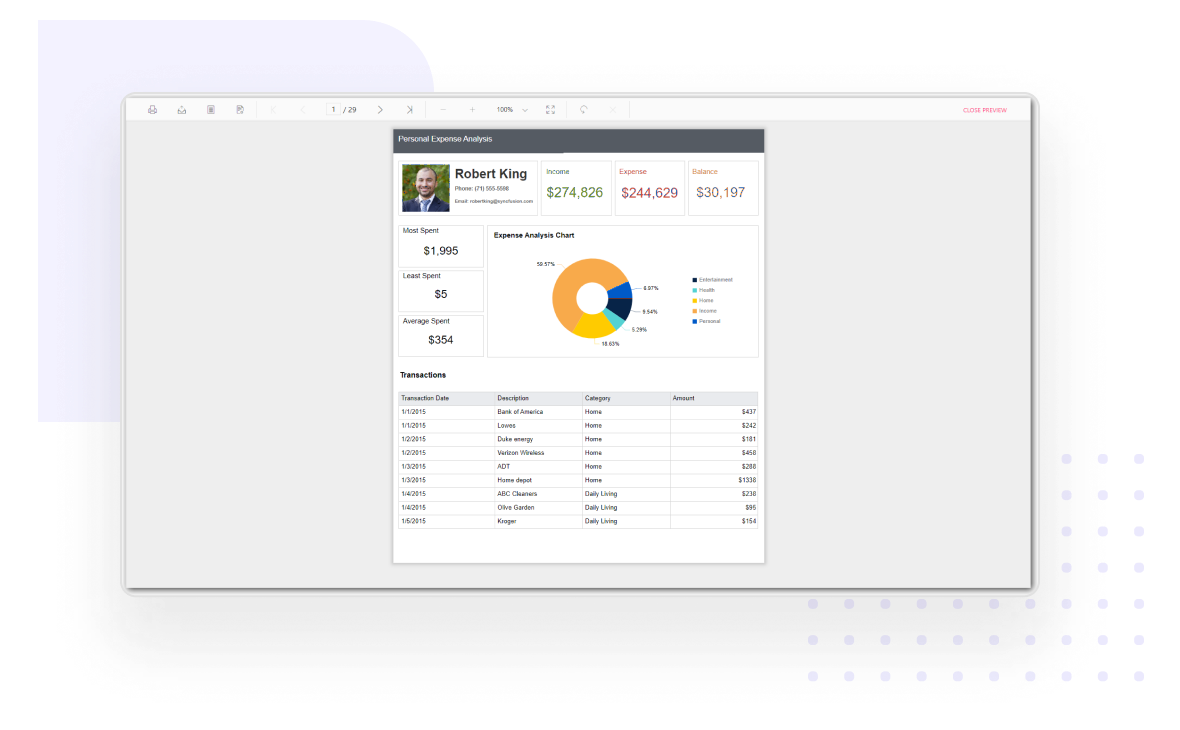
The Bold Reports JavaScript Report Viewer displays paginated report data from a data set in a table, matrix (pivot table), or list. These items organize cells into rows and columns. Item-specific features like multiple grouping and sorting, section totals, header repeating, and free-form layouts make the report more readable.