






SAMPLE REPORT FOR DATA VISUALIZATION

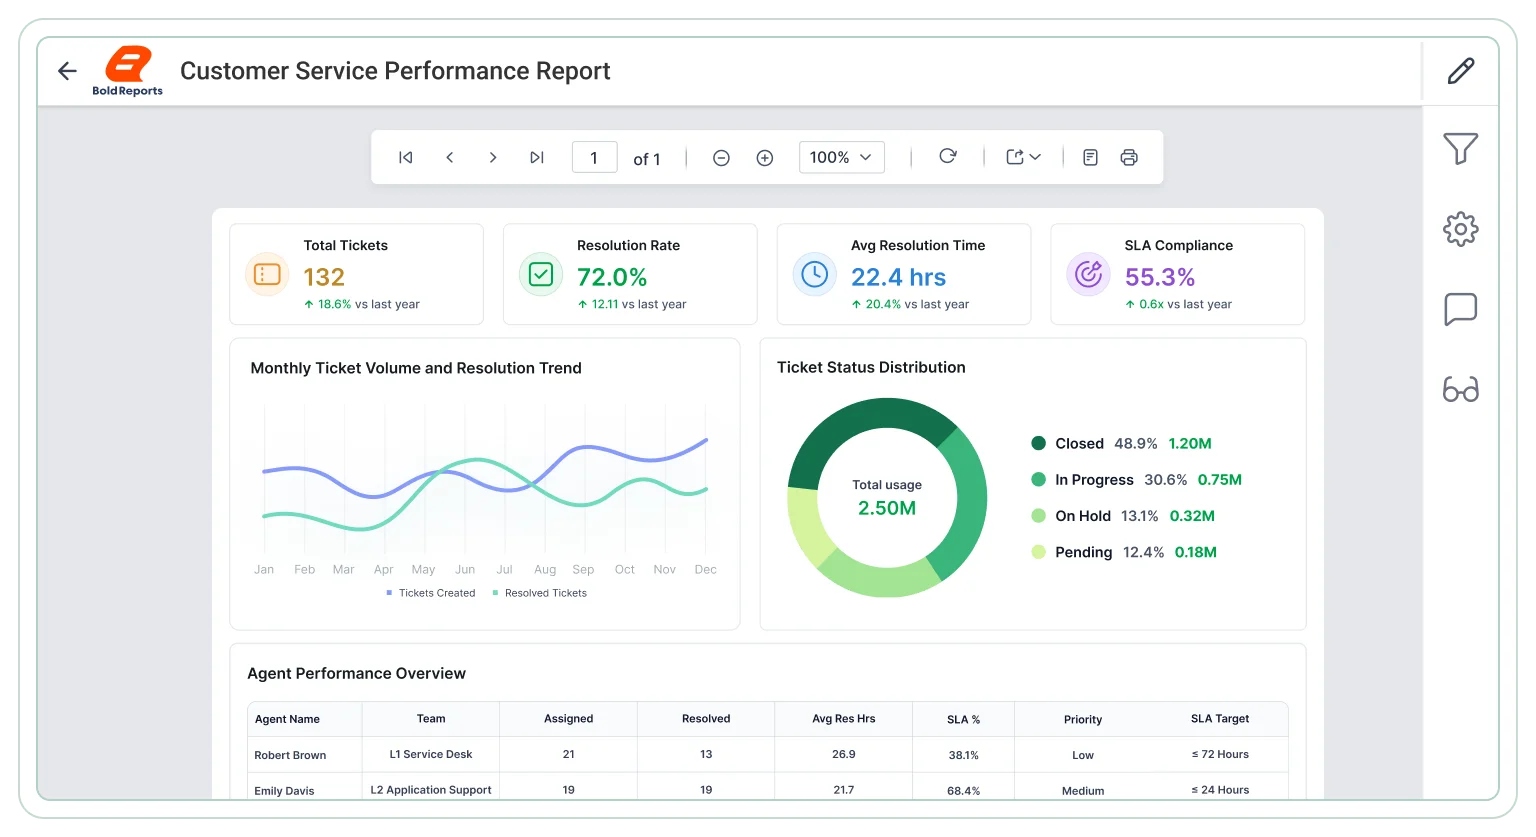
Customer Service Performance Report

Measure support efficiency with a paginated report for trend analysis, comparison, and visibility into resolution trends, SLA performance, service demand, and workflow efficiency across reporting workflows.

Editable .rdl file i The download includes the report .rdl file only. Upload it to Bold Reports Designer to preview, edit, and customize the report based on your requirements.

Need help customizing the report? Explore the documentation or contact our support team.

Customer service performance report
Trusted by leading companies

J&J

Schneider

Bridgestone

Siemens

Verizon

HP

Fidelity

Intel

Core reporting capabilities

Explore key use cases

Customer service reporting supports resolution tracking, SLA monitoring, workload evaluation, and demand analysis. Bold Reports helps teams prepare export-ready reports for service reviews.

Resolution performance review

Understand incoming service patterns to evaluate operational pressure and service demand trends.

  • Track support request volume across periods and peak demand windows.
  • Compare ticket trends across periods and identify demand spikes.
  • Identify peak demand windows and compare tickets across periods.
  • Measure first-contact resolution rates across support interactions.
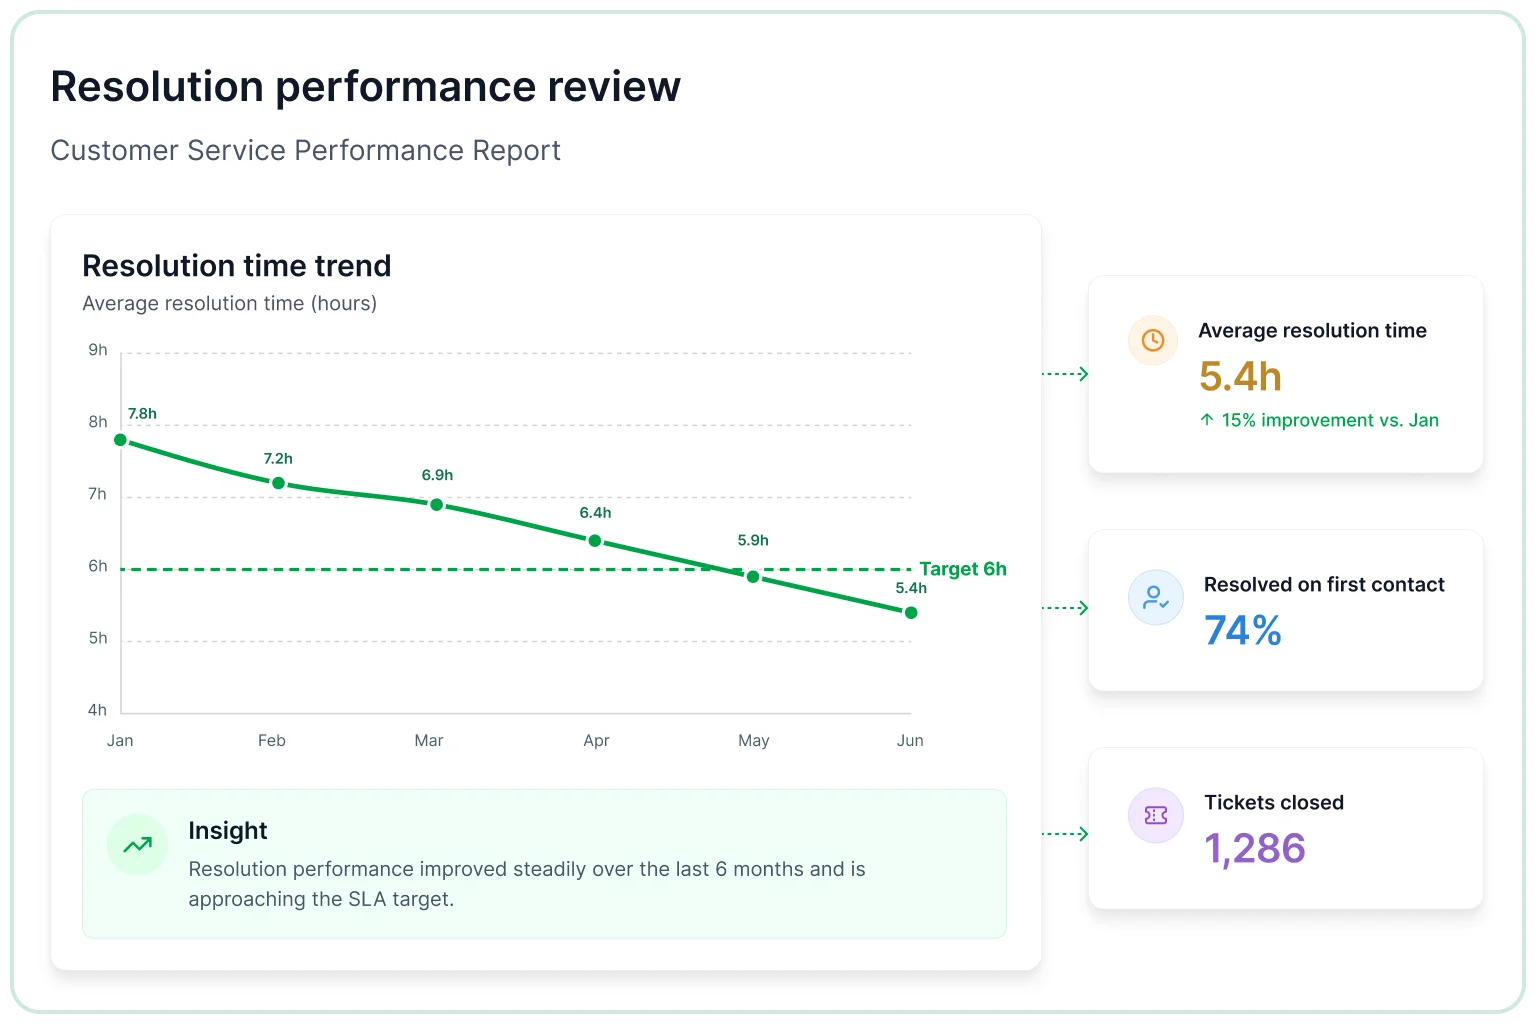
Resolution performance

SLA compliance monitoring

Evaluate adherence to service targets to identify risks and maintain operational standards.

  • Track SLA compliance across periods and identify service gaps.
  • Compare breach rates across queues and highlight delayed tickets.
  • Identify delayed ticket categories and improve resolution speed.
  • Measure response and resolution performance across reporting periods.
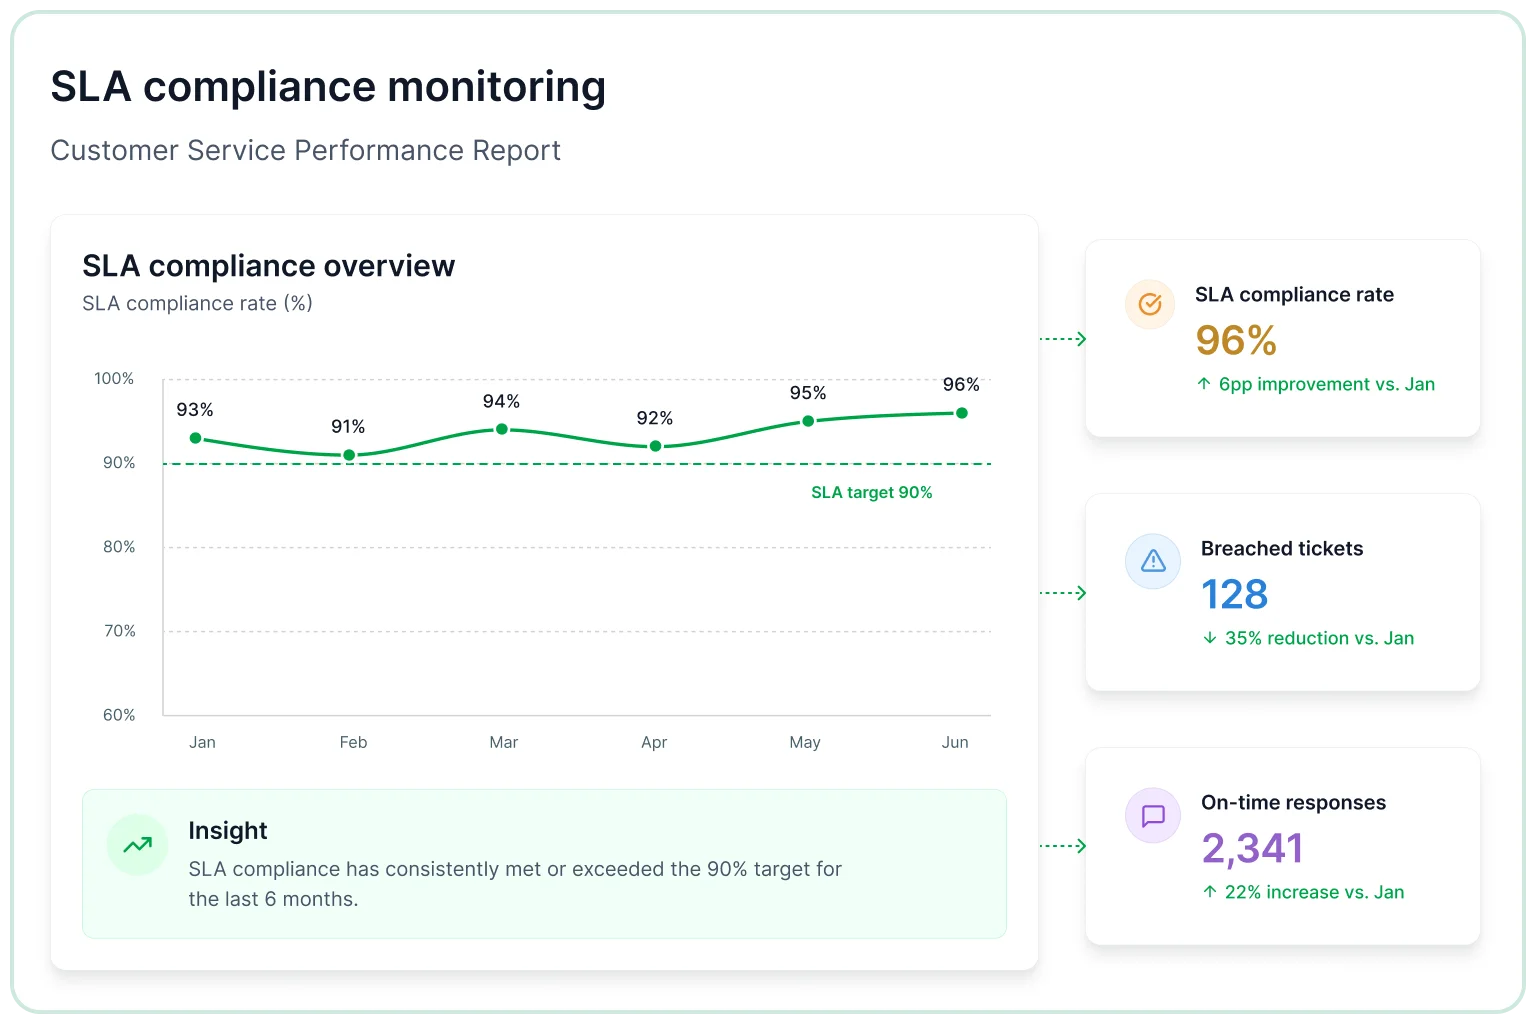
SLA compliance monitoring

Technician workload evaluation

Analyze productivity and workload distribution to improve team efficiency and balance resources.

  • Compare ticket volume by technician to balance workload evenly.
  • Review average handle time and identify agents needing support.
  • Identify workload imbalances and measure resolution output by agent.
  • Measure resolution output by agent across periods and queue types.
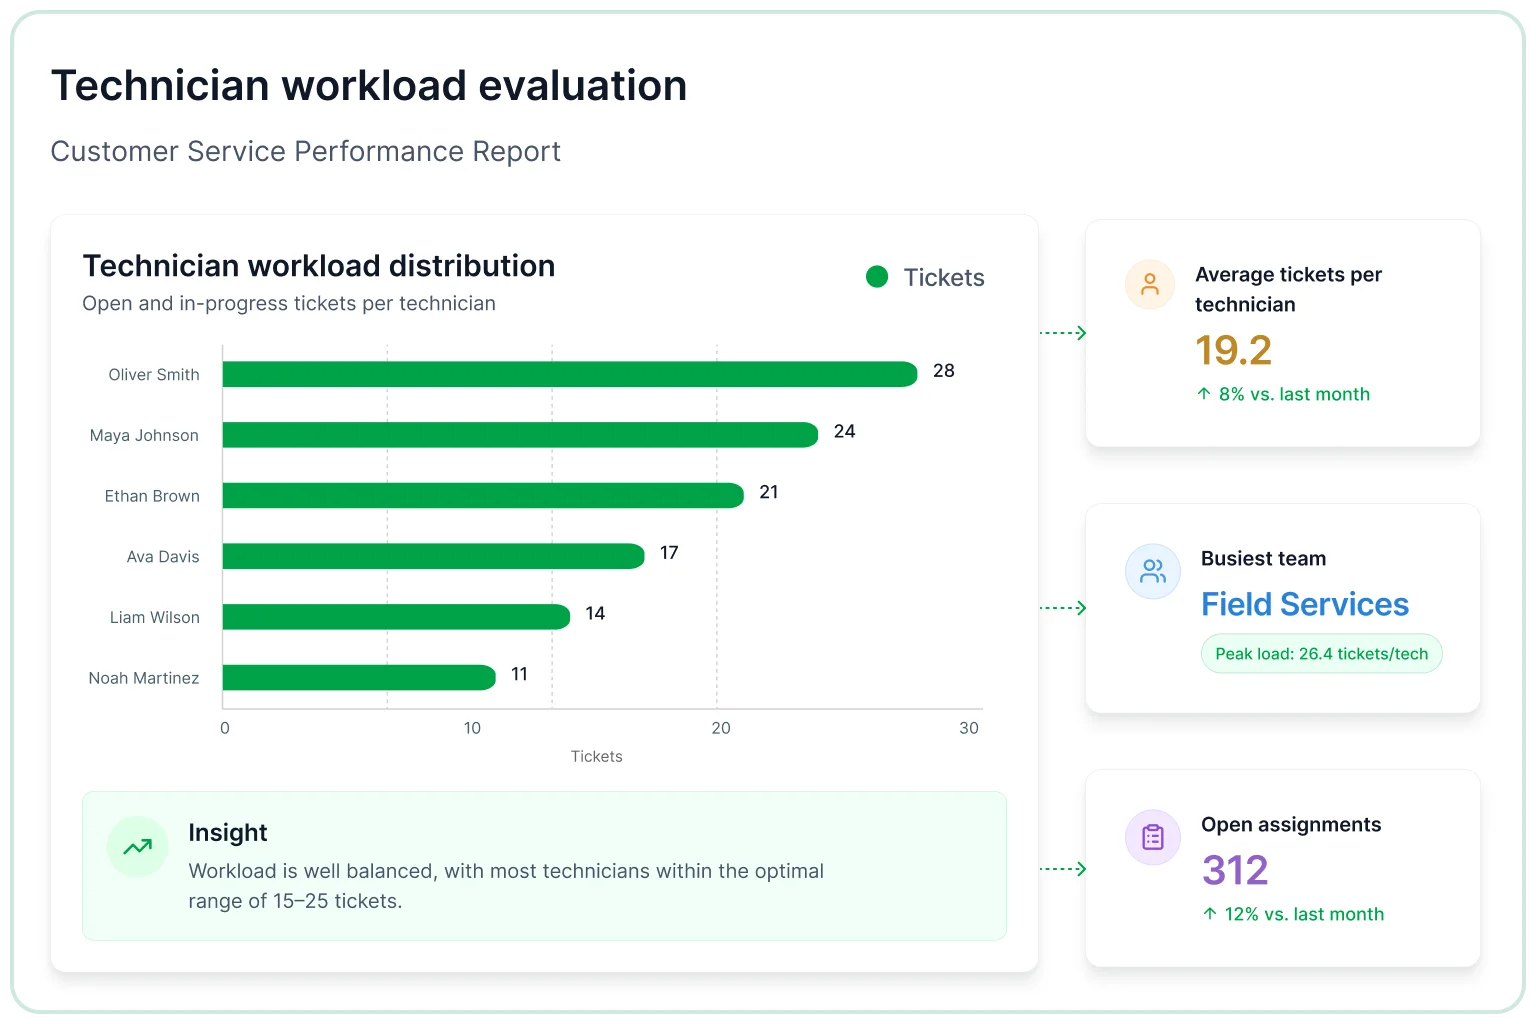
Technician workload evaluation

Support demand analysis

Understand incoming service patterns to evaluate operational pressure and service demand trends.

  • Track support request volume across periods and peak demand windows.
  • Compare ticket trends across periods and identify demand spikes.
  • Identify peak demand windows and compare tickets across periods.
  • Measure first-contact resolution rates across support interactions.
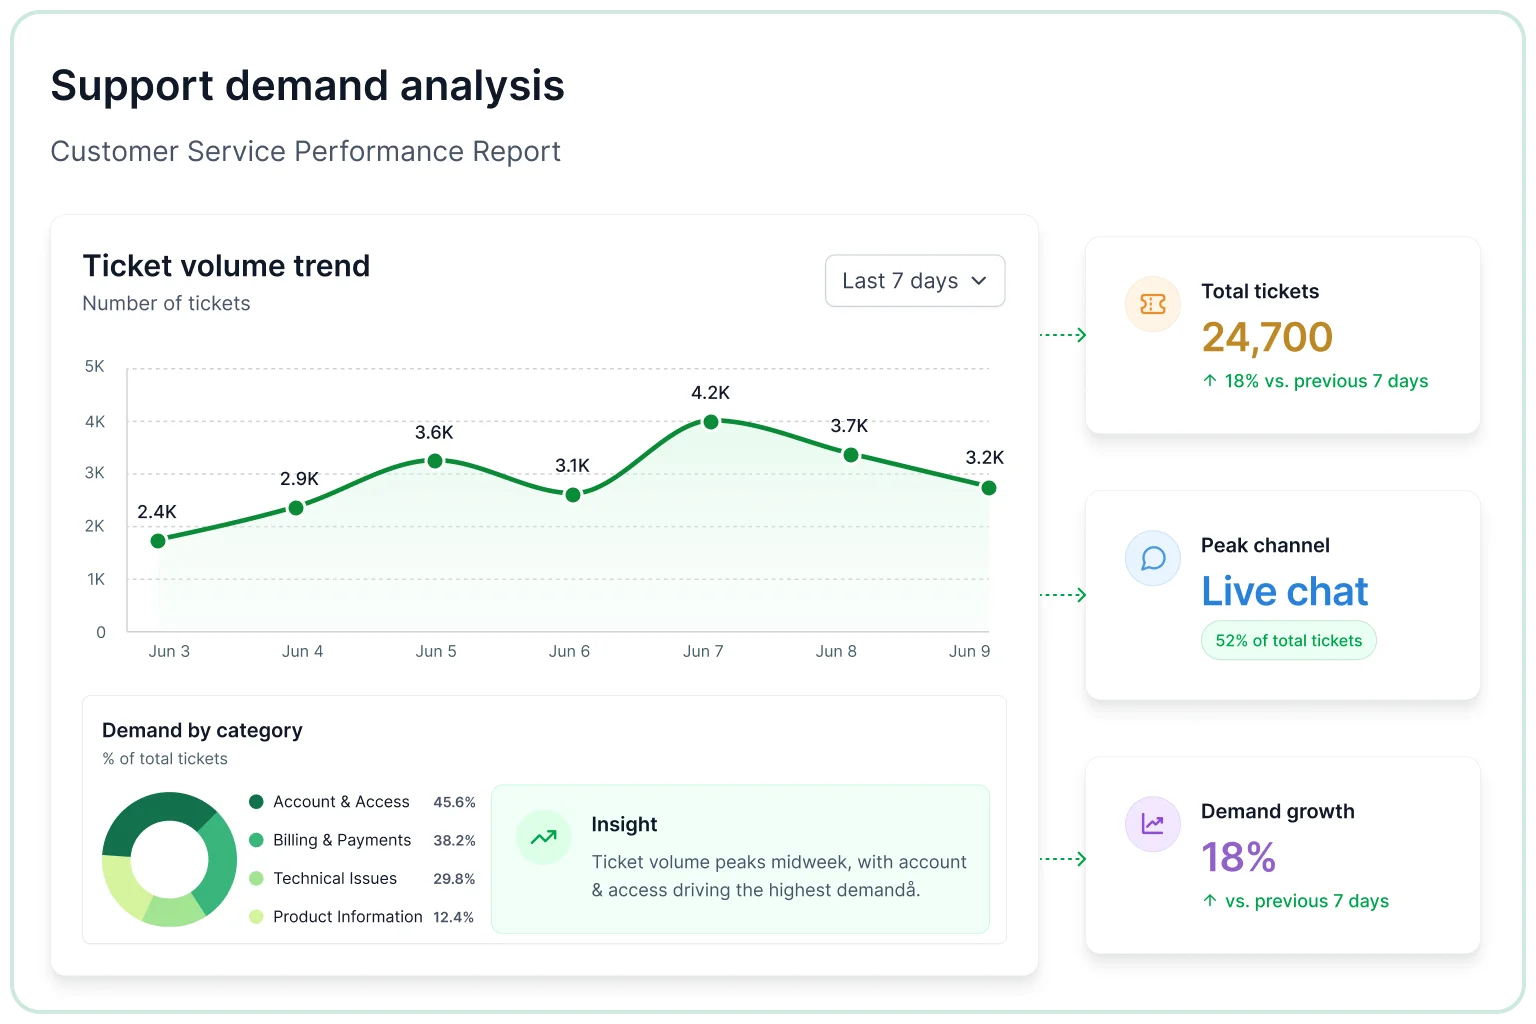
Support demand analysis
Monitor critical KPIs

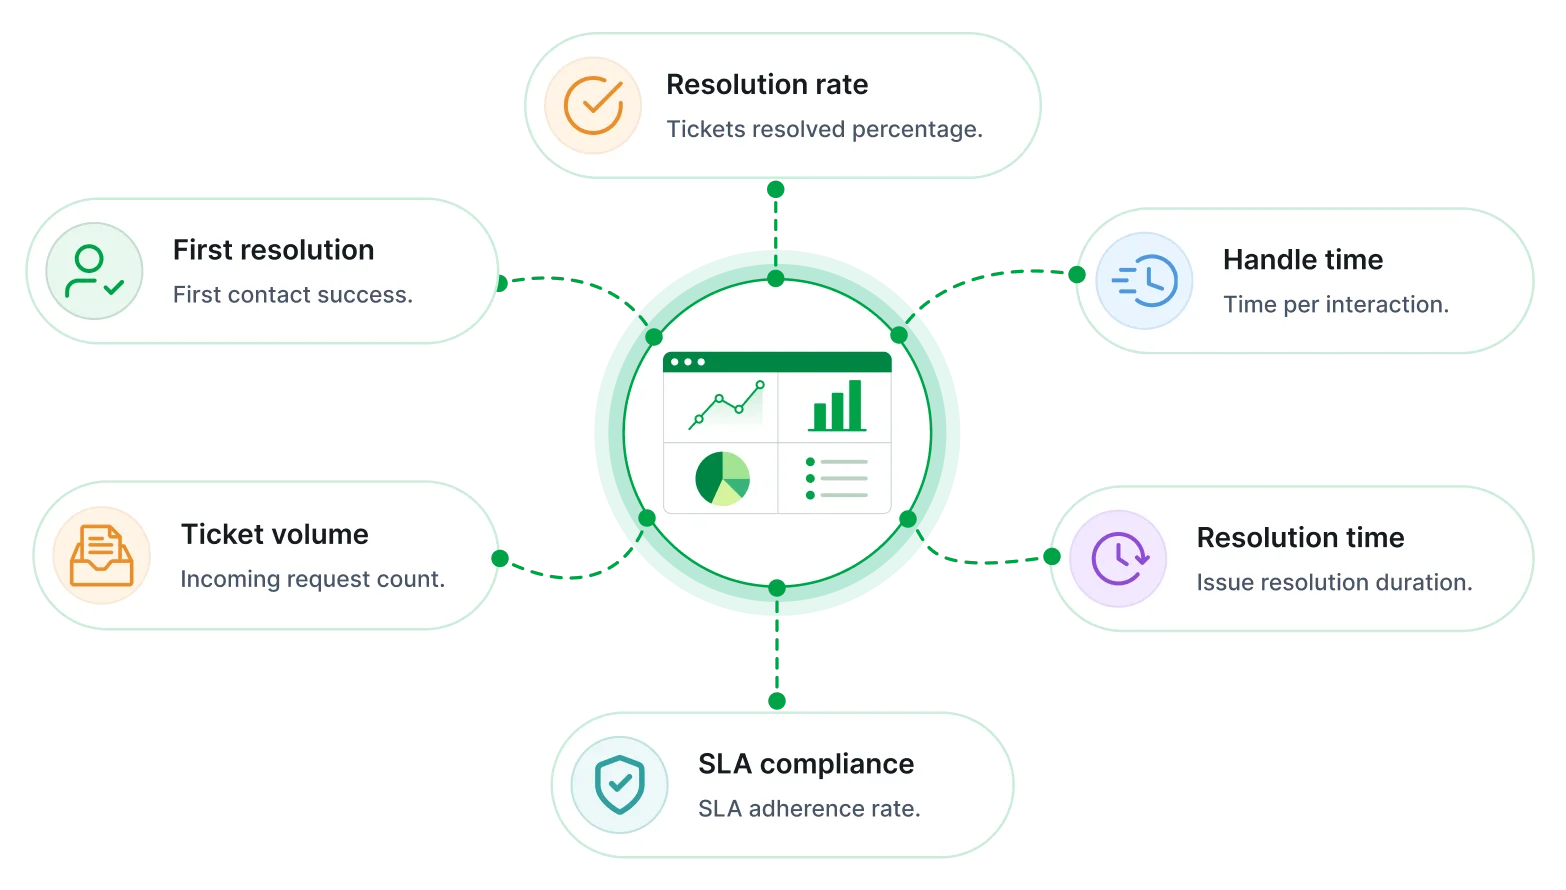
Track key metrics

These metrics provide a focused and comprehensive view of service efficiency, workload distribution, and support performance across teams and channels.

Customer service performance report key metrics
Overview of this report

What is a customer service performance report?

This report brings together ticket resolution activity, SLA adherence, technician workload, and support demand into a unified view, helping organizations evaluate service efficiency, identify bottlenecks, and improve overall support operations. 

End-to-end service visibility

Provide a clear view of support activity from ticket creation through resolution.

Demand and capacity tracking

Understand how incoming requests impact service operations and resource planning.

SLA and performance alignment

Monitor how service delivery aligns with defined response and resolution targets.

Consistent performance monitoring

Track service efficiency using structured metrics across reporting periods.

Workload and productivity insights

Analyze how tickets are distributed and handled across teams and agents.

Actionable service improvement

Identify opportunities to reduce delays, improve response times, and enhance support quality.

No credit card required.

Built for your team

Designed for IT & service teams

Access structured insights into service performance, request handling, and operational workflows through a unified reporting approach. 

Designed for IT and service teams
Centralized reporting

Centralized reporting

Combines all support data into one unified view for consistent analysis and comprehensive cross-team visibility.

Service performance tracking

Service performance tracking

Monitors resolution trends and SLA compliance across tickets, teams, and timeframes for quality assurance.

Secure and role-based access

Secure & role-based access

Ensures controlled visibility of sensitive service information with granular permissions for different user levels.

Workload insights

Workload insights

Evaluate technician productivity, case distribution, and efficiency to improve overall team performance.

Automated report delivery

Automated report delivery

Schedules and distributes reports through configurable channels ensuring timely updates to stakeholders.

Operational visibility

Operational visibility

Compare performance across queues, channels, and demand levels to find gaps and guide decisions.

Tailor to your needs

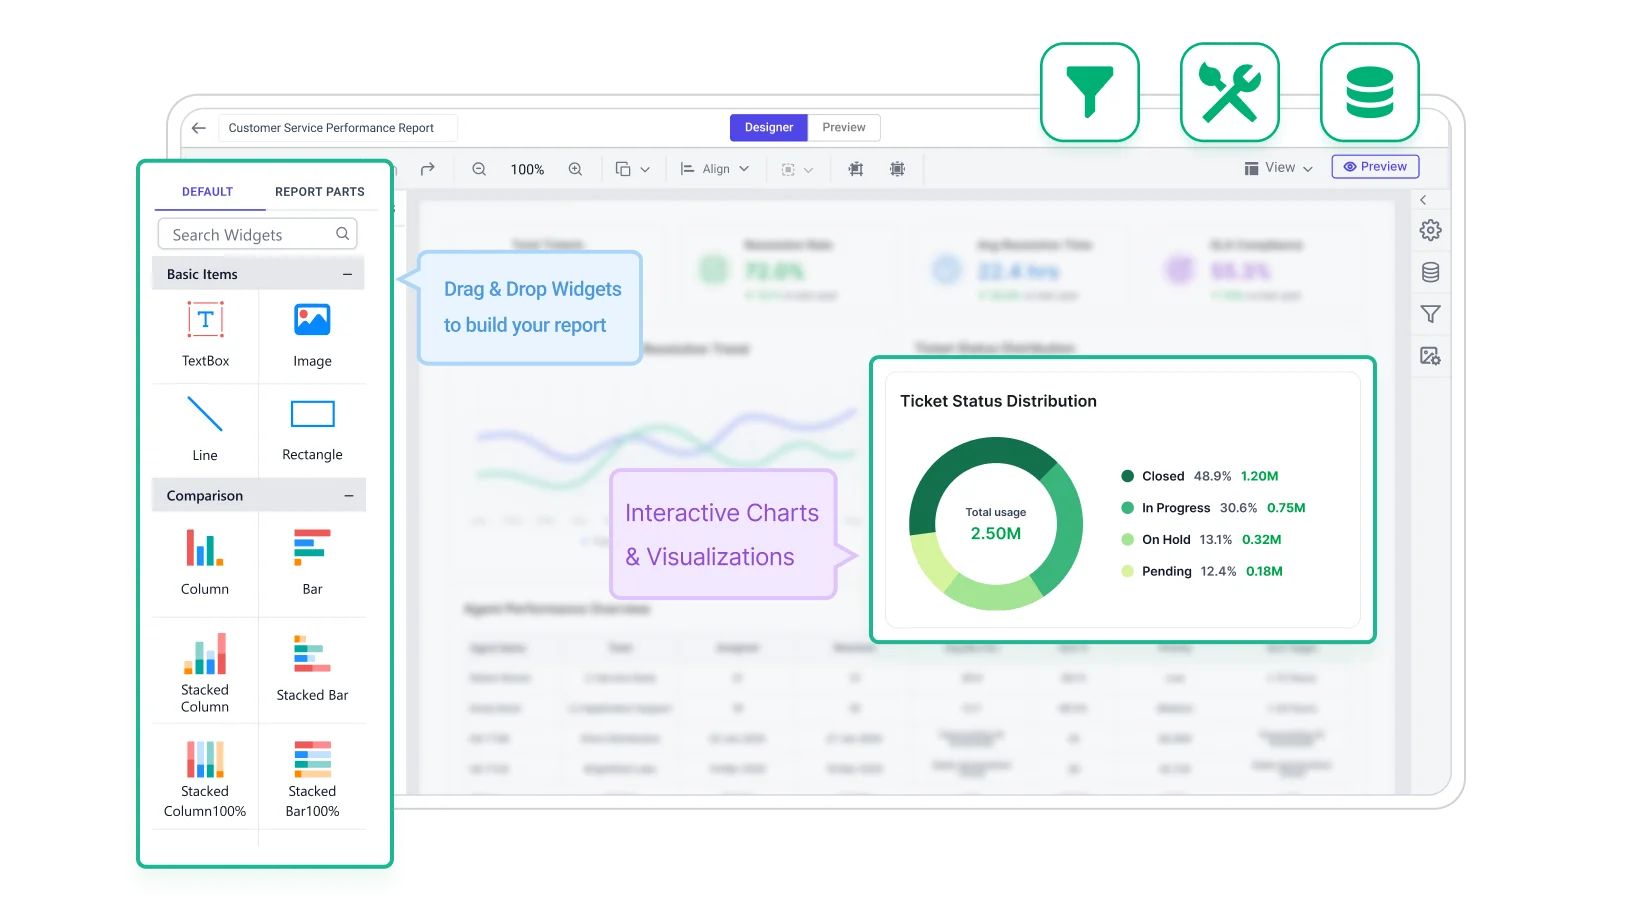
Build & customize

Customer service reporting can be configured around KPIs, filters, and recurring delivery requirements. Bold Reports supports export-ready layouts and scheduled outputs for service analysis. 

Filter icon

Filter queue, technician, priority, date.

Track KPI icon

Track KPI resolution, SLA, and workload data.

Drill icon

Drill into ticket and service records.

Export report icon

Export reports in shareable formats.

Schedule recurring report icon

Schedule recurring report delivery.

Build and customize customer service performance report

No credit card required.

Templates

Customer service performance report templates

Gain visibility into service performance and improve operational efficiency with structured IT reporting across teams, queues, and service workflows.

Connectors

Data integrations

Connect to over 25+ data sources from files and databases to web services for flexible integration, transformation, and storage, all ready for reporting.

Common education reporting questions

Frequently asked questions

Find answers on measuring response times, resolution rates, ticket volumes, and service efficiency to improve support operations and planning.

Stop Exporting Data. Start Embedding Reports.

Turn your data into production-ready reports instantly

Create pixel-perfect, print-ready reports with powerful exporting and zero complexity.

No credit card required.