







Project performance visibility
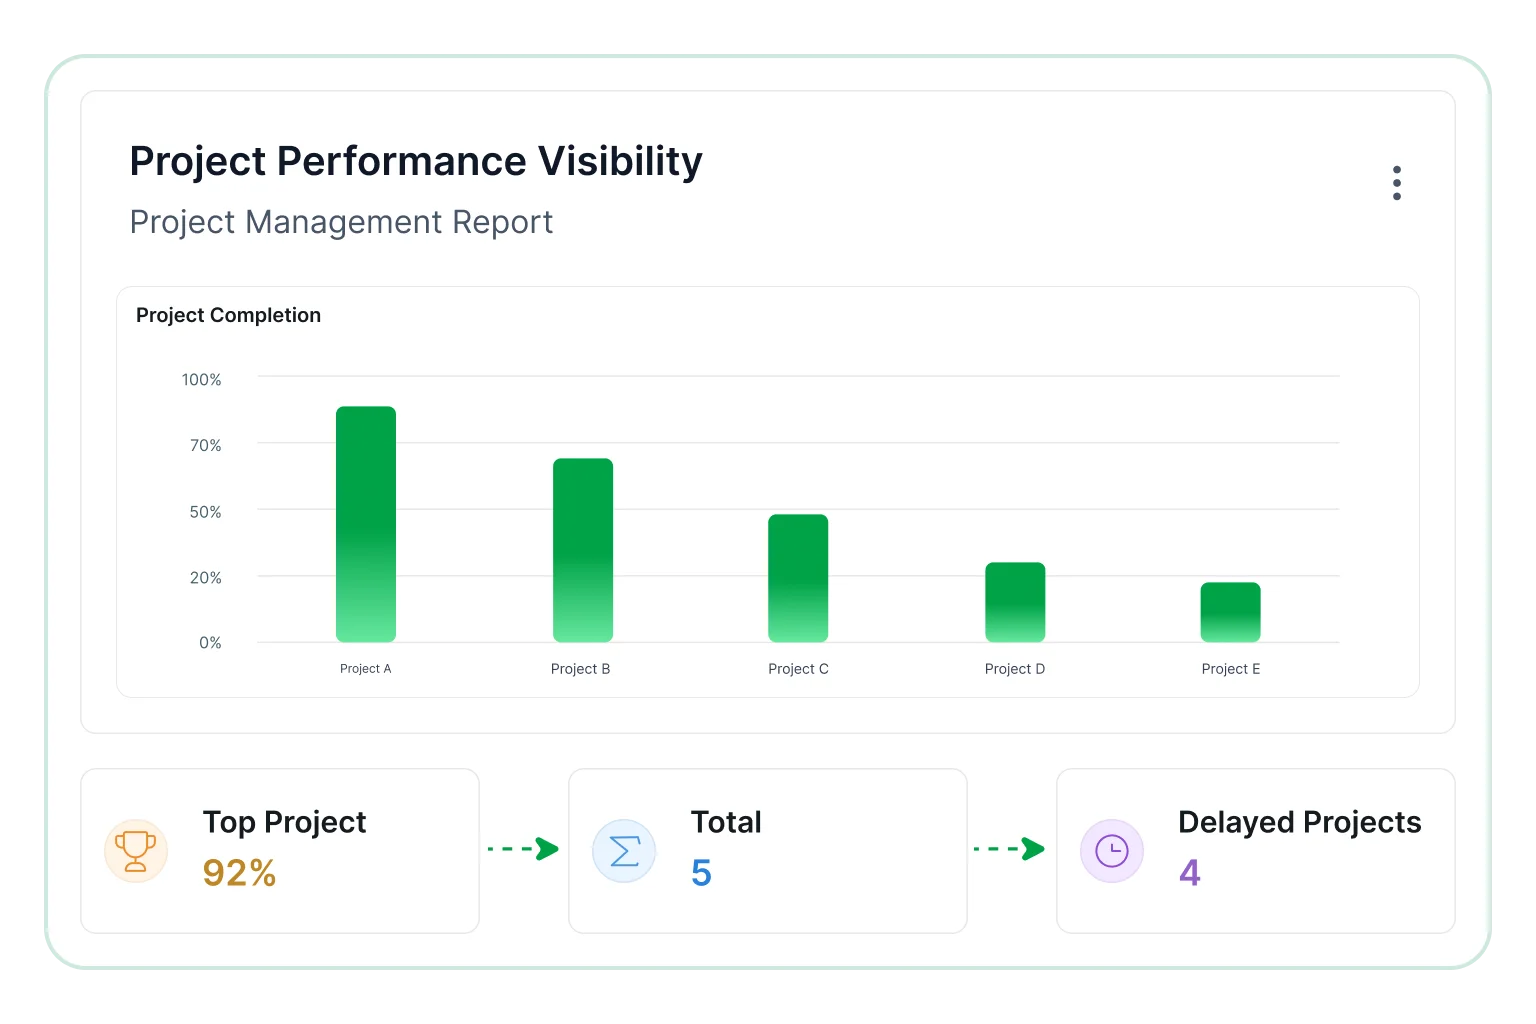
Ensure clear understanding of project timelines, progress status, and schedule deviations across multiple initiatives.
- View completion percentage alongside expected timelines closely.
- Compare planned schedules with actual duration outcomes closely.
- Highlight delayed initiatives needing corrective action promptly.
- Improve decision speed with centralized visibility across teams.
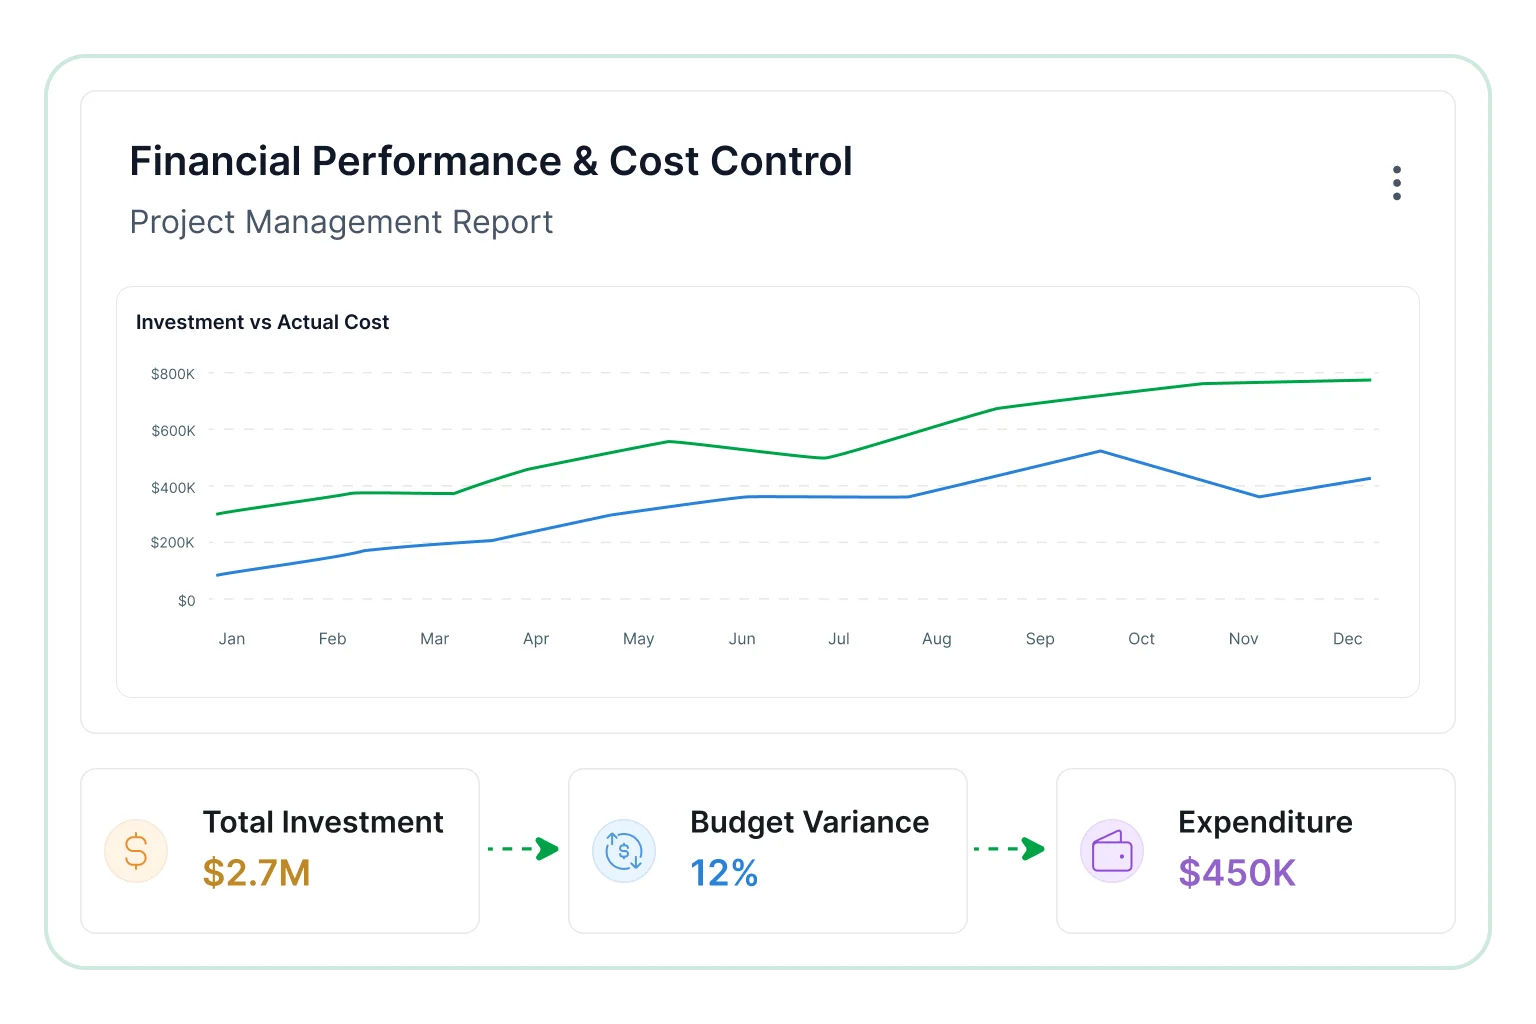
Financial performance and cost control
Maintain full transparency into investments, billed revenue, and cost distribution to strengthen financial discipline.
- Compare revenue trends with investment allocations for planning.
- Break down expenses across operational categories more clearly.
- Detect overspending patterns across projects before costs grow.
- Strengthen profitability through cost governance and control.
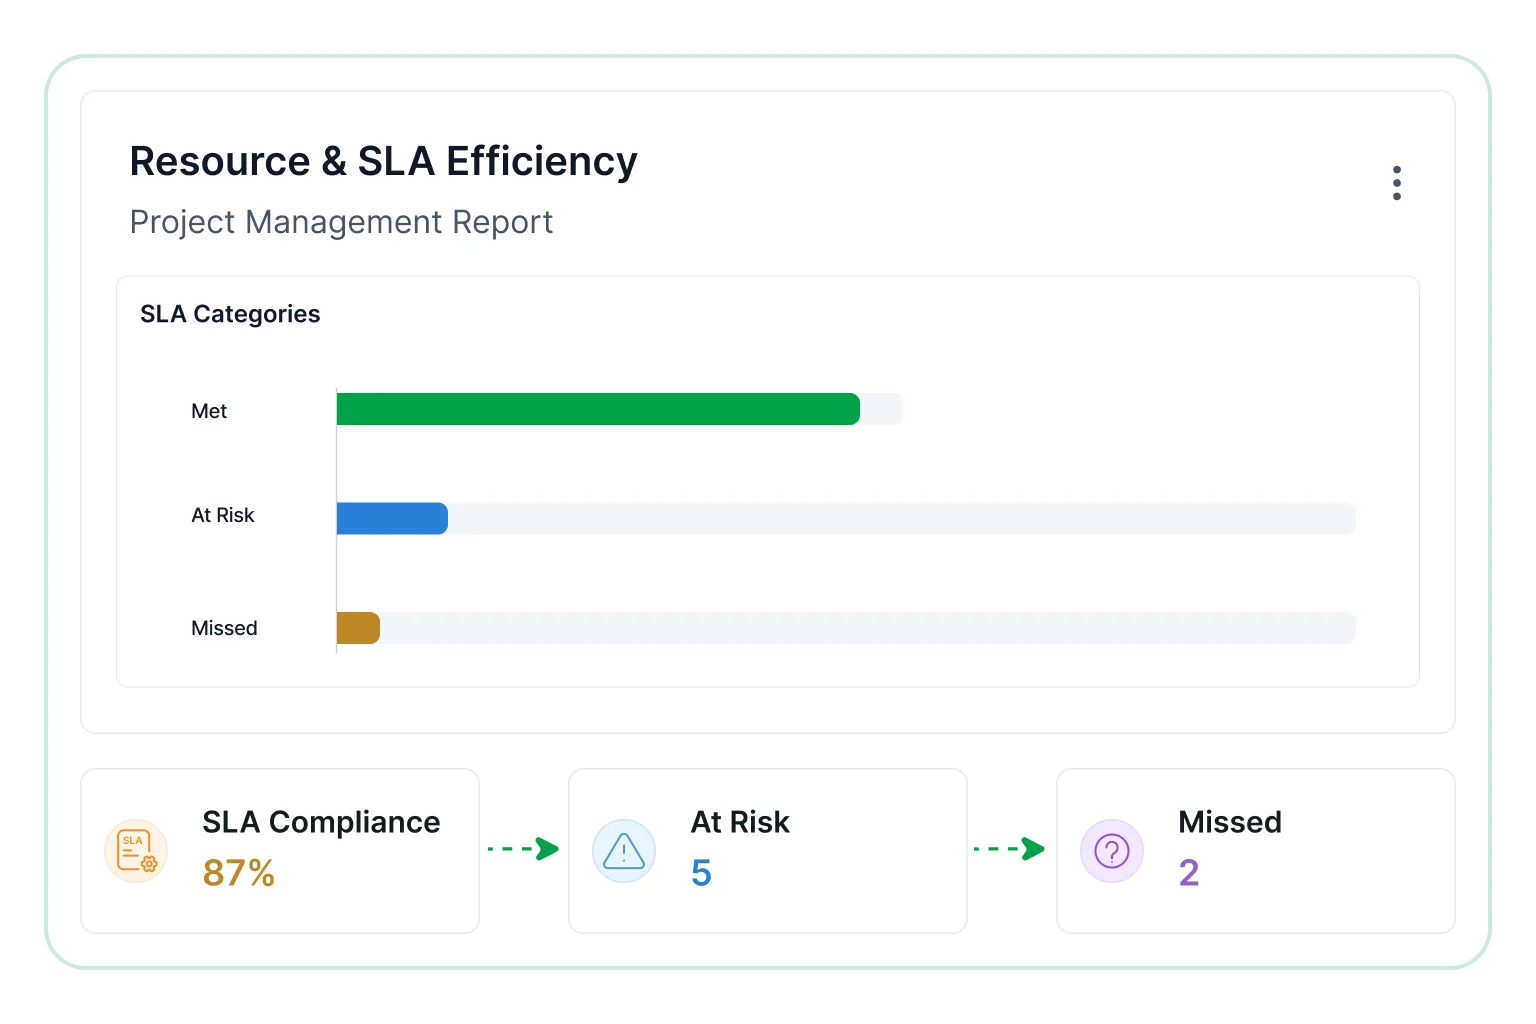
Resource and SLA efficiency
Improve service consistency and workload balance through better visibility into SLA adherence and team allocation.
- View SLA performance across active initiatives for timely review.
- Highlight service gaps requiring immediate attention from teams.
- Improve allocation efficiency across teams for better results.
- Strengthen delivery quality with structured insights and action.
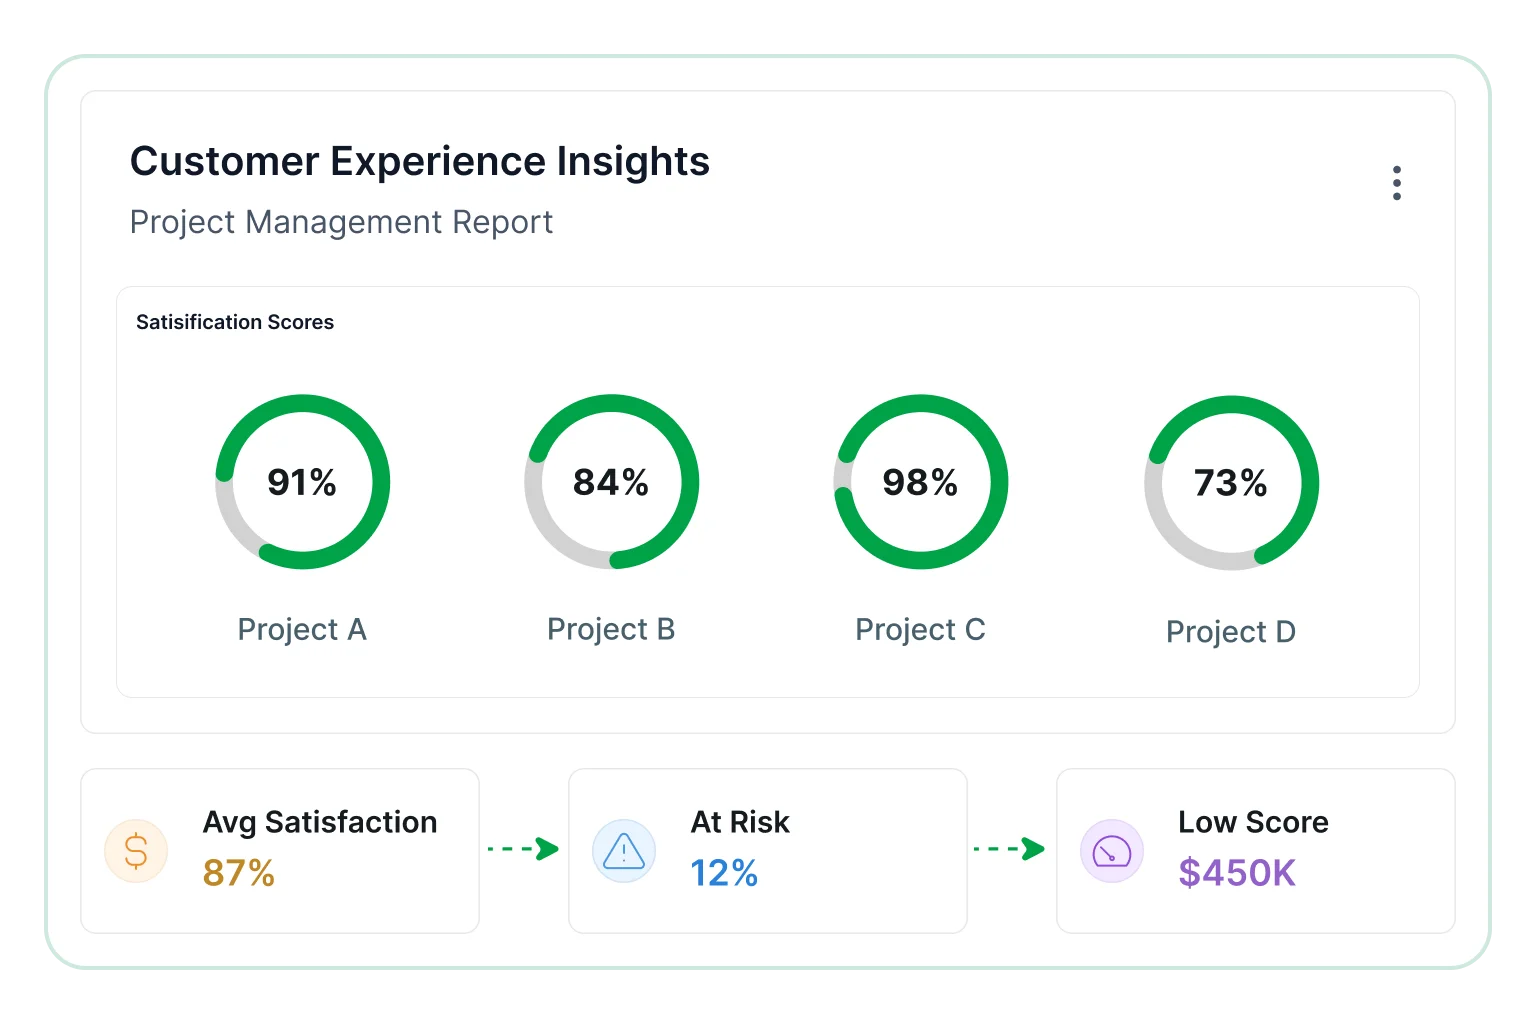
Customer experience insights
Understand satisfaction levels across projects to improve delivery standards and long-term client relationships.
- View satisfaction scores for each engagement to track experience.
- Contrast performance across project teams for clearer comparisons.
- Detect areas impacting client experience and improve service.
- Strengthen trust through consistent service delivery across teams.
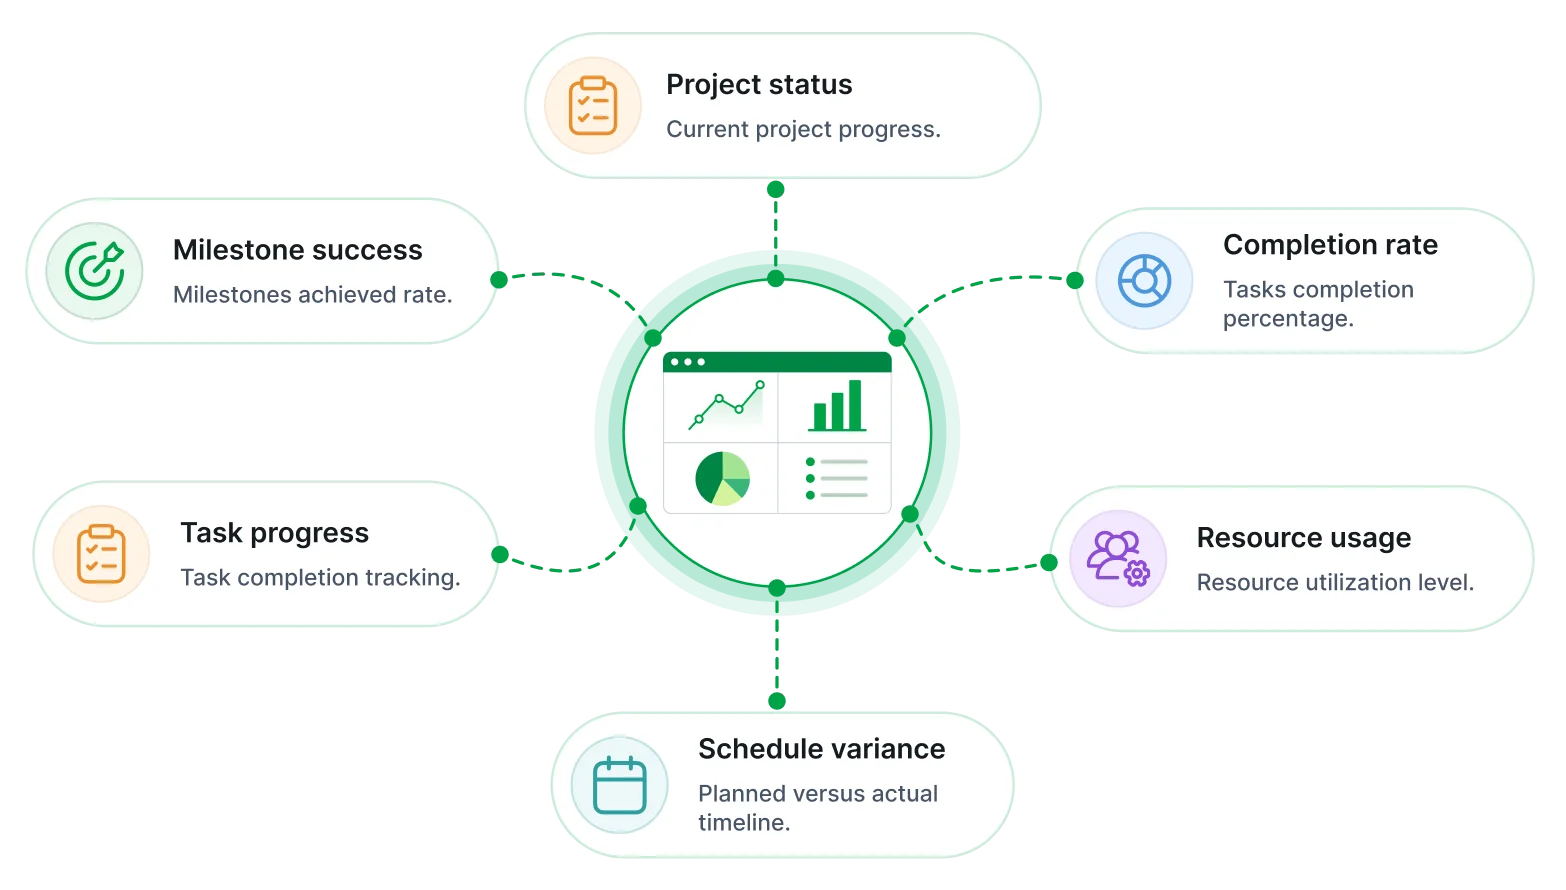

Structured delivery insight
Gain a structured view of timelines, milestones, and completion progress across projects to ensure smoother execution.

Centralized control
Manage reporting assets, user roles, and permissions effectively from a unified platform environment.

Stronger execution control
Strengthen control over financials, schedules, and risks with centralized visibility supported by authentication.

Reduced manual effort
Automate recurring reporting processes and simplify data consolidation with Bold Data Hub capabilities.

Seamless integration
Embed reporting capabilities into business applications for consistent data experience using embedded reporting.

Custom reporting experience
Tailor dashboard appearance and presentation to match business needs using flexible branding options.

Centralized reporting
Combine data from multiple project sources into one consistent view for planning and performance.

Resource insights
Gain clarity into team allocation and utilization patterns to improve efficiency and balance workloads effectively.

Secure and role-based access
Enable controlled data access with authentication, to protect sensitive project information.

Execution visibility
Understand timelines, milestones, and delivery progress to maintain clarity across ongoing and completed initiatives.

Automated report delivery
Distribute updates through scheduled workflows, ensuring stakeholders receive timely and consistent project insights.

Project visibility
Compare progress, risks, and outcomes across initiatives to support informed planning and strategic alignment.

Filter projects by team, timeline, status

Measure KPI progress, usage, outcomes.

Dril into milestones, tasks, owners.

Export reports in shareable formats for teams.

Schedule automated delivery for consistency.