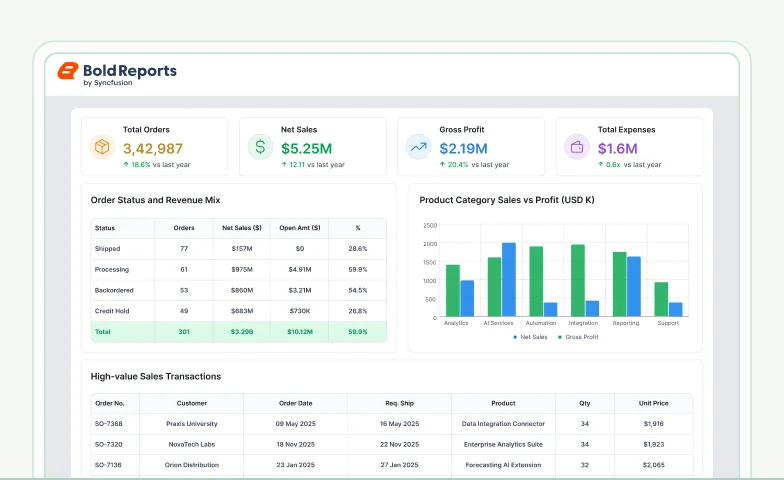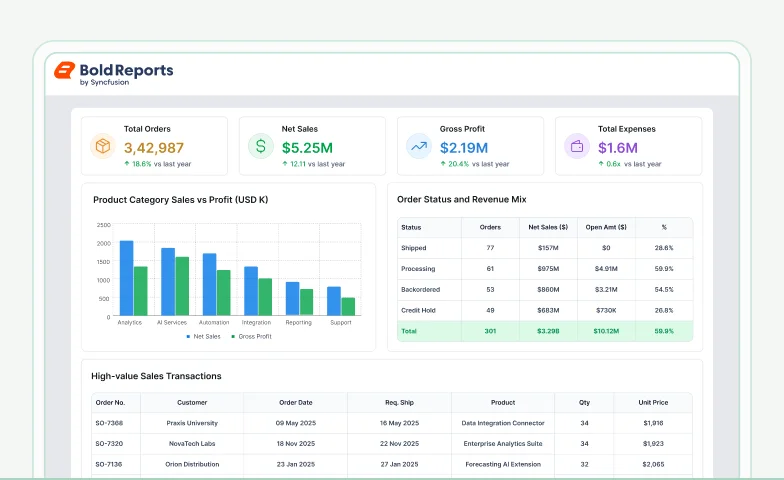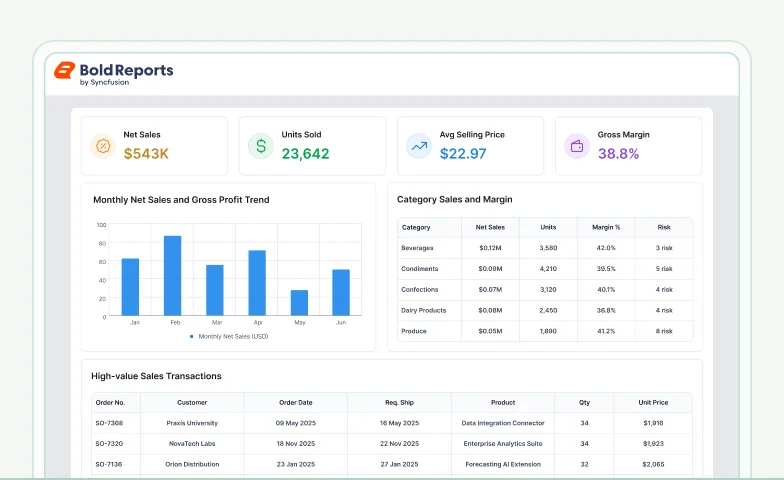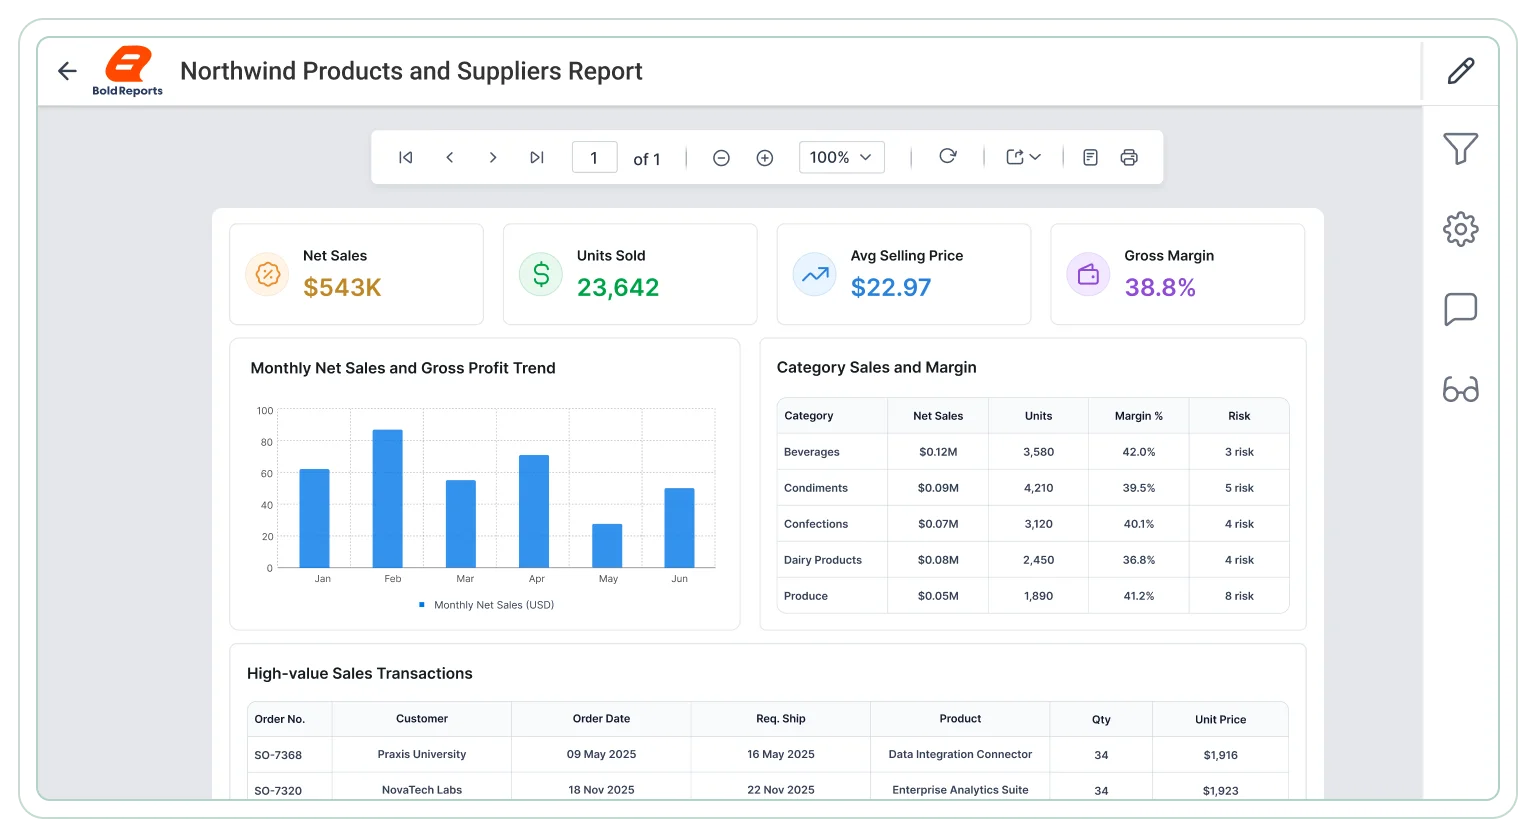







Northwind Products and Suppliers Report
Assess product performance, inventory movement, and supplier contributions with a paginated report designed for clear visibility into stock behavior and fulfilment activity across structured reporting workflows.
Editable .rdl file
i
The download includes the report .rdl file only. Upload it to Bold Reports Designer to preview, edit, and customize the report based on your requirements.
Need help customizing the report? Explore the
documentation
or
contact
our support team.
J&J
Schneider
Bridgestone
Siemens
Verizon
HP
Fidelity
Intel
Explore key use cases
Product and inventory reporting supports performance evaluation, stock monitoring, supplier analysis, and fulfilment tracking with structured outputs for operational planning and procurement decisions.
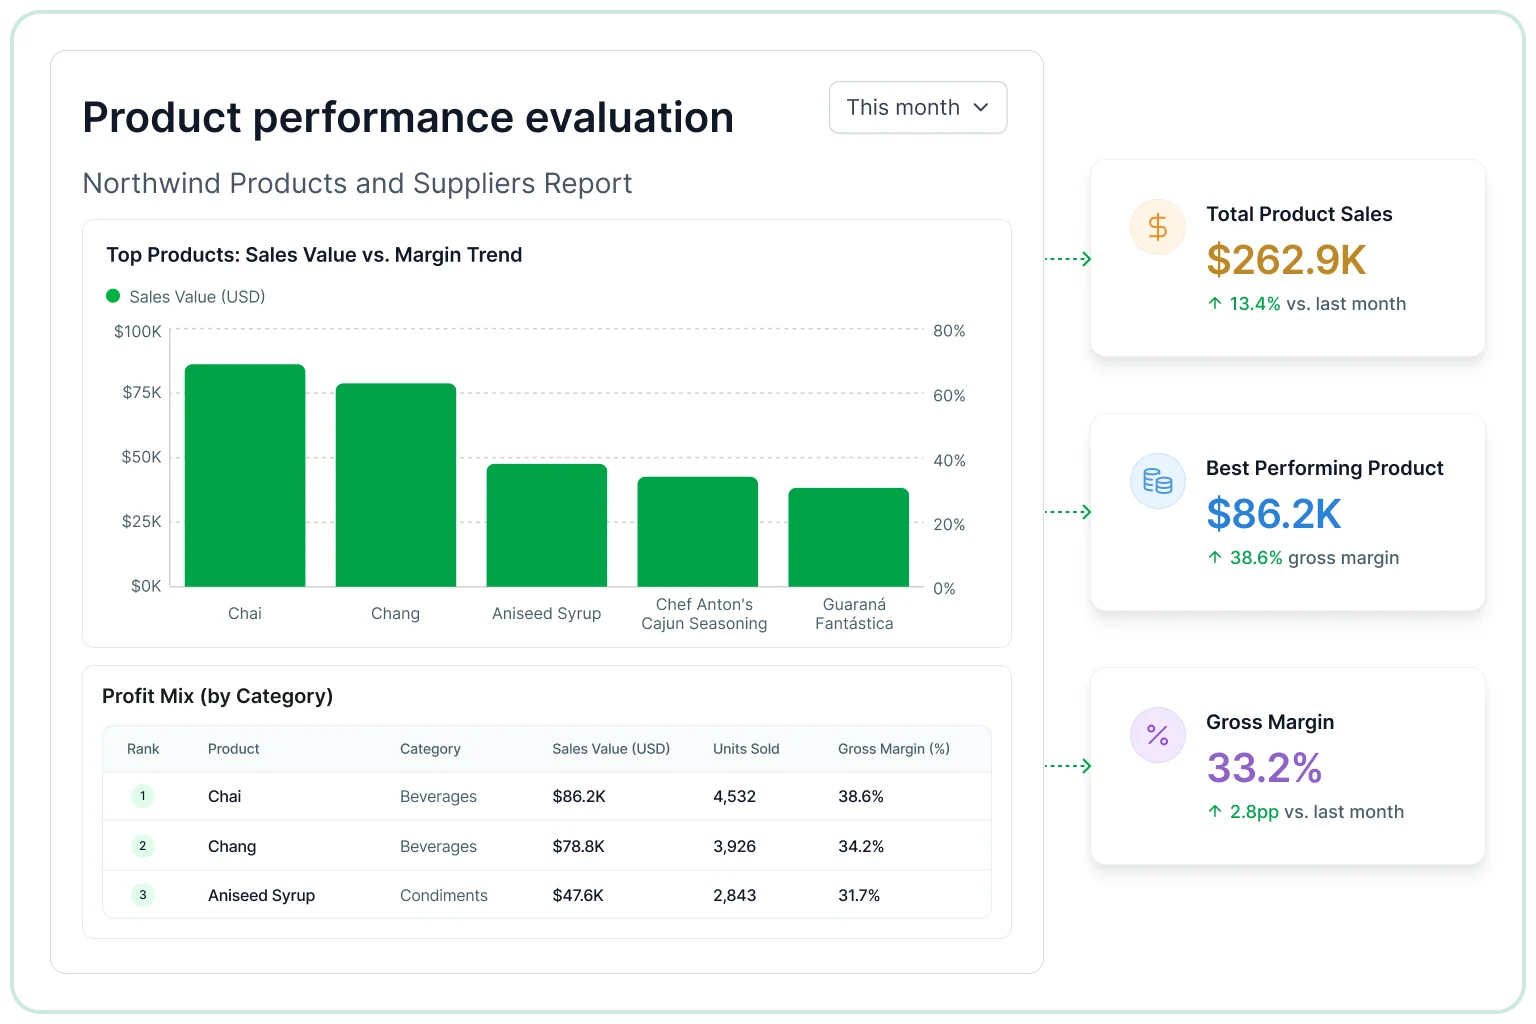
Product performance evaluation
Monitor product performance over time to identify profitability trends and key contributors across SKUs and categories.
- Review product revenue against associated costs clearly.
- Analyze SKU-level sales performance across periods.
- Identify top and low-performing products consistently.
- Measure profit contribution by item clearly.
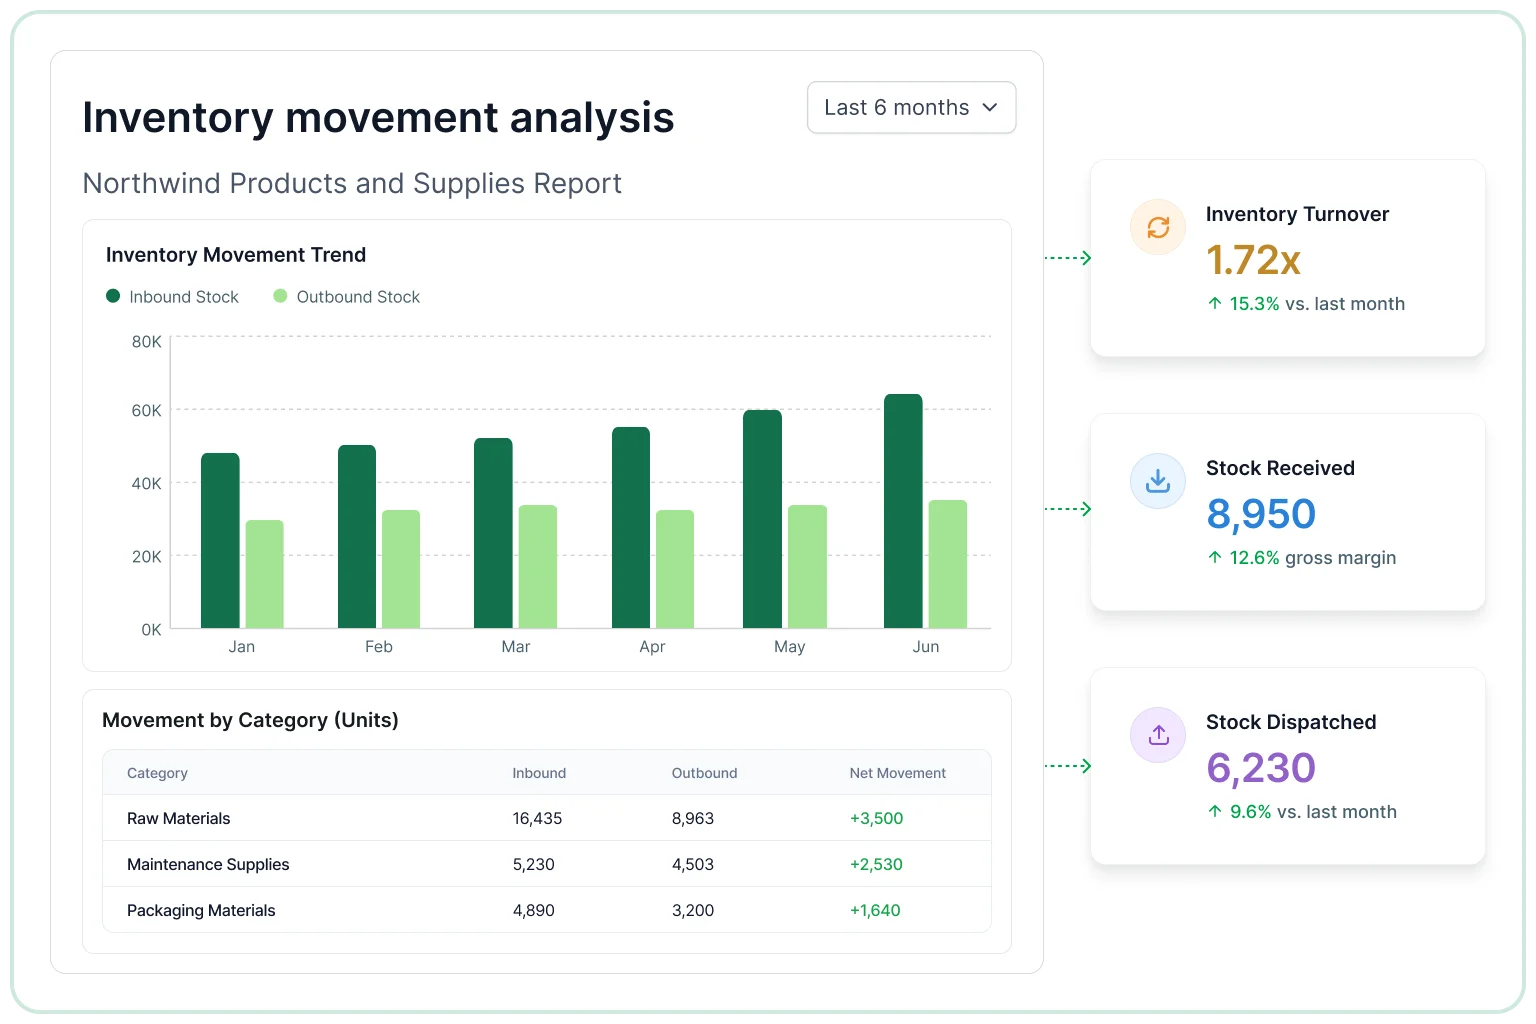
Inventory movement analysis
Understand how products move through inventory cycles to improve stock control and efficiency.
- Track inventory levels across SKUs consistently.
- Evaluate stock turnover efficiency over time.
- Identify slow-moving or excess inventory clearly.
- Compare stock movement across categories.
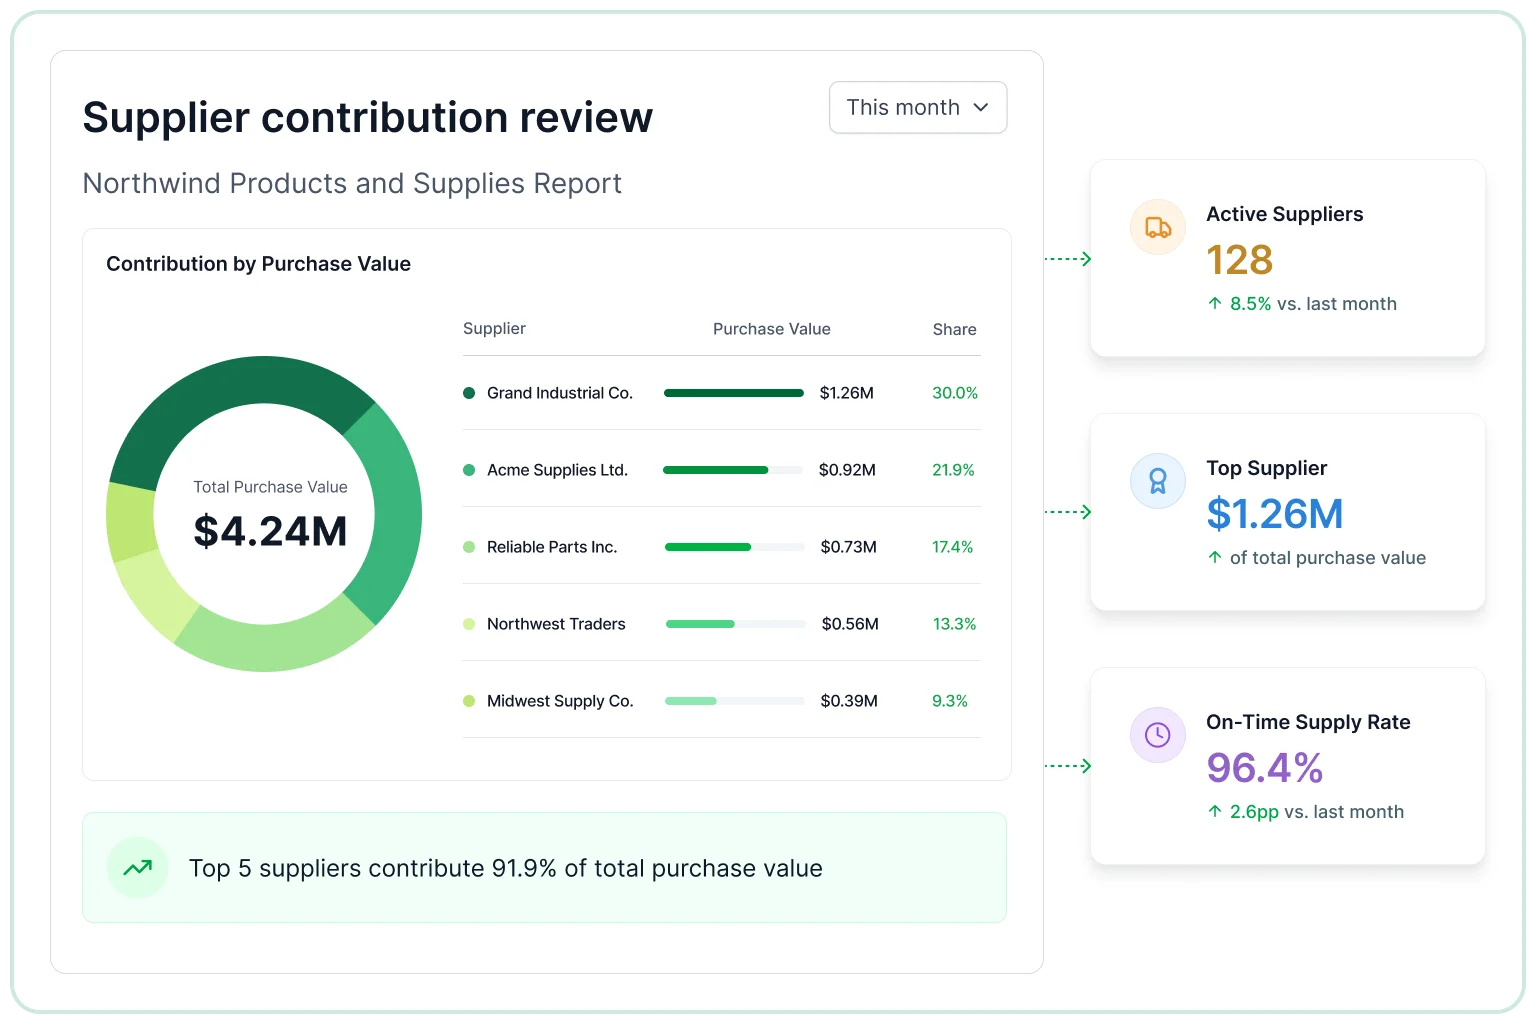
Supplier contribution review
Evaluate supplier performance to understand sourcing reliability and consistency.
- Compare supplier lead times across reporting periods.
- Assess delivery reliability clearly.
- Identify recurring supply delays over time.
- Review product availability by supplier.
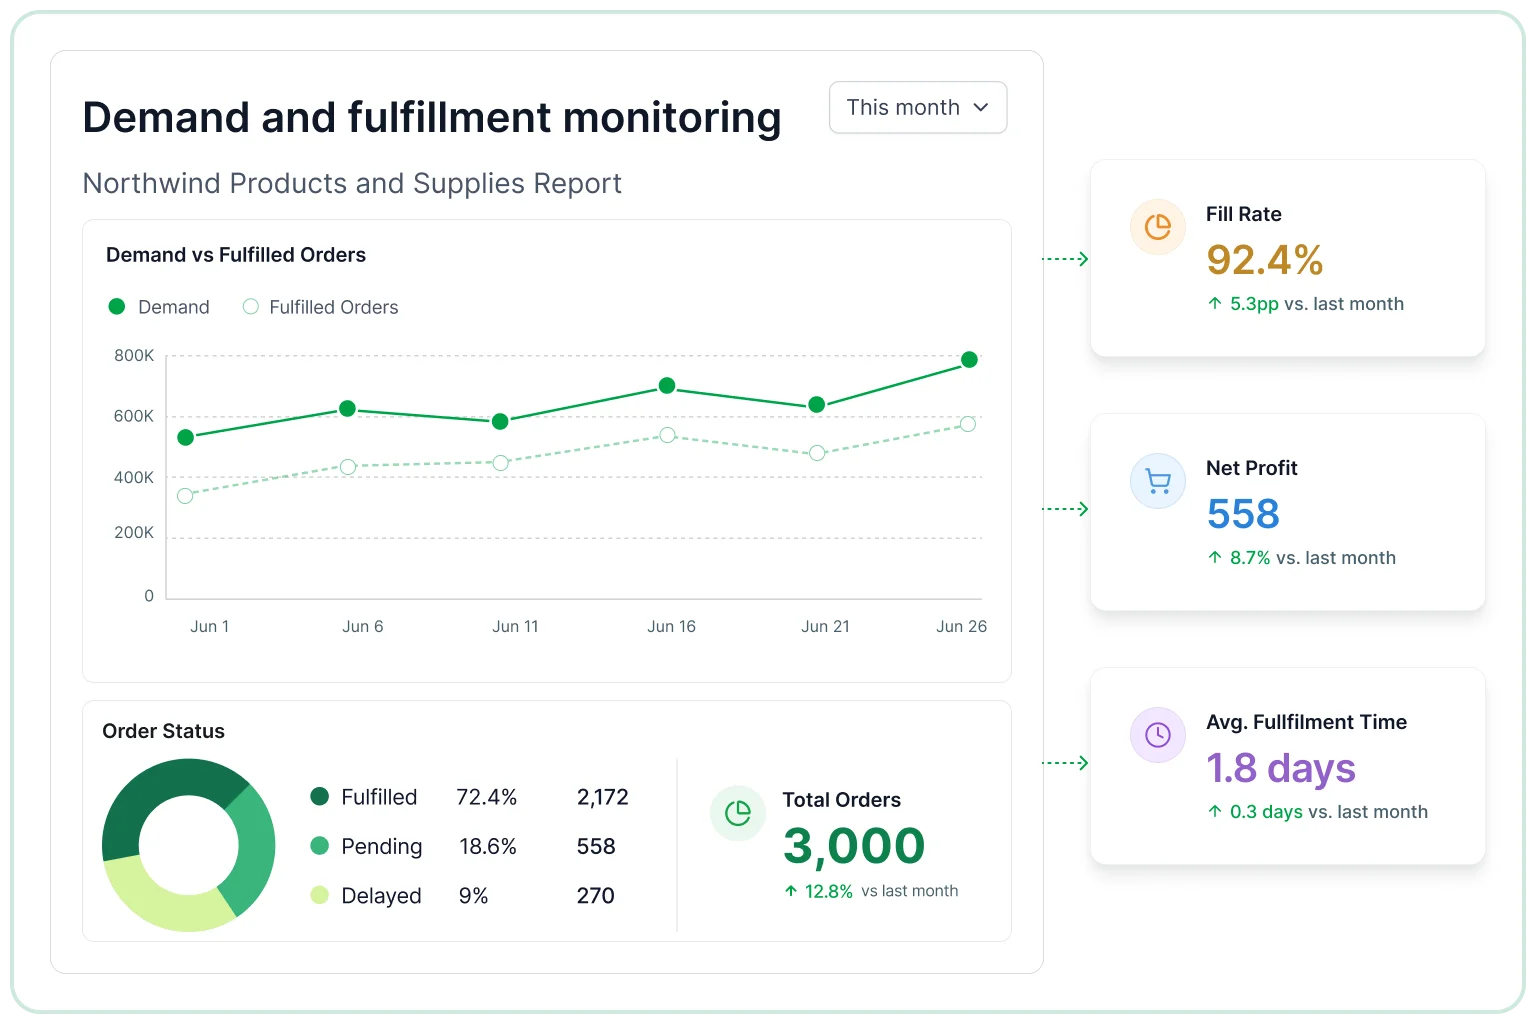
Demand and fulfillment monitoring
Examine demand patterns and fulfillment performance to improve operational responsiveness.
- Track fulfillment status by product consistently.
- Compare demand trends across reporting periods.
- Identify recurring stock shortages clearly.
- Analyze customer-driven demand patterns.
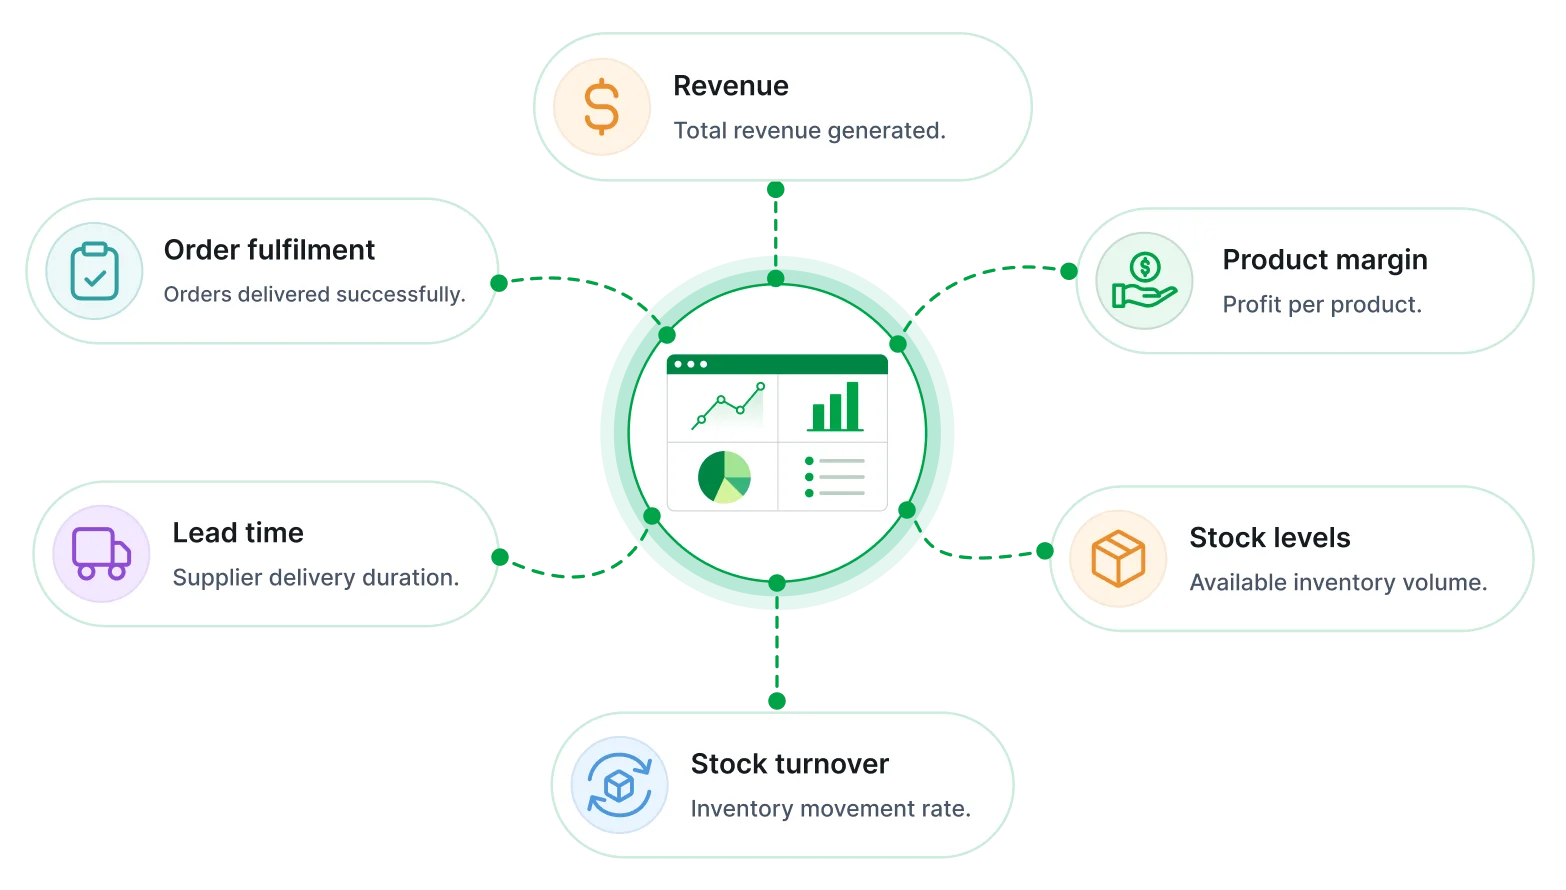
Track key metrics
These metrics provide a clear view of product performance, inventory efficiency, supplier reliability, and fulfillment outcomes to support better decisions.
What is a northwind products and supplier report ?
This report brings together product sales, inventory levels, supplier activity, and fulfillment insights into a unified view, helping organizations understand product flow, track operational efficiency, and improve procurement and inventory decisions.
Operational visibility
Provide a clear view of product movement from procurement through fulfillment.
Demand and fulfillment alignment
Connect customer demand with stock availability and fulfillment outcomes.
Inventory efficiency tracking
Monitor stock levels, turnover, and availability across reporting periods.
Consistent performance monitoring
Track product, inventory, and supplier performance using structured outputs.
Supplier performance clarity
Evaluate sourcing reliability and delivery timelines across suppliers.
Improved decision support
Enable informed planning across operations, inventory, and procurement teams.

No credit card required.
Designed for operations & inventory teams
Gain structured insights into product activity, inventory flow, supplier performance, and demand trends through a unified reporting approach.
Centralized reporting
Combines product, supplier, and inventory data into one view for consistent, accurate, cross-team analysis.
Product performance reviews
Ensures controlled visibility and secure handling of operational data across teams and locations.
Secure and role-based access
Ensures controlled visibility and secure handling of operational data across teams and locations.
Inventory monitoring
Analyzes stock levels, turnover efficiency, and replenishment needs to avoid waste, shortages, and stockouts.
Automated report delivery
Delivers reports through scheduled generation, formatting, and distribution for recurring use each time.
Supplier & fulfillment insights
Evaluates sourcing, delivery speed, and partner reliability to improve service and reduce delays.
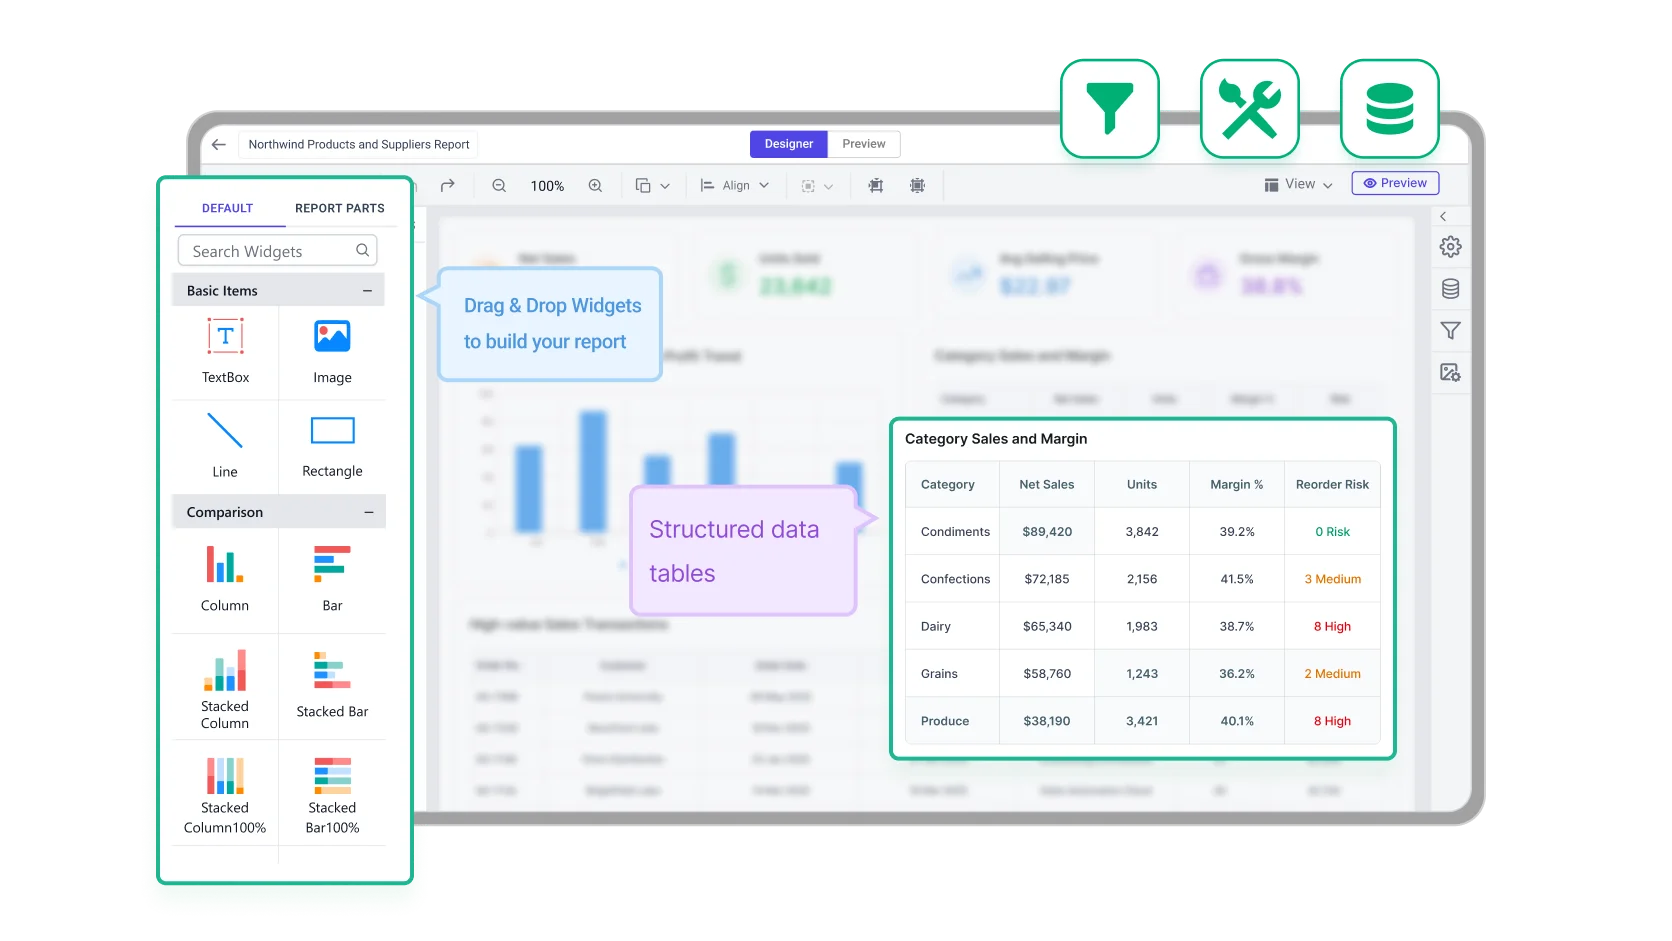
Build & customize
Product and inventory reporting can be configured around KPIs, filters, and recurring delivery requirements. Bold Reports supports export-ready layouts and scheduled outputs for operational analysis.
Add filters for supplier, category, SKU, region.
Configure KPIs for margins, turnover, stock.
Enable product and supplier data drill down.
Export reports in shareable formats.
Schedule recurring report delivery.
No credit card required.
Northwind products and suppliers report templates
Track sales performance, uncover trends, and support forecasting with structured, data-driven reporting for informed decisions.
Sales Performance Report
Evaluate overall sales performance across revenue, customers, and regions.
Sales Analysis Report
Explore sales data to identify trends and performance drivers.
Financial Analysis Report
Assess financial performance across revenue, costs, and profitability.
Ticket Sales Analysis Report
Analyze ticket sales performance and customer demand across events, categories, and purchase trends.
Data integrations
Connect to over 25+ data sources from files and databases to web services for flexible integration, transformation, and storage, all ready for reporting.
Frequently asked questions
Get answers on product listings, supplier details, pricing, stock availability, and how product–supplier relationships are tracked.
Weekly reporting is commonly used for active inventory, while slower-moving products are reviewed monthly.
Lead time is measured from purchase order to delivery and averaged by supplier.
Yes, purchasing systems can be connected to update SKU cost metrics automatically, ensuring accurate cost tracking and up-to-date reporting.
Yes. Bold Reports supports tracking changes between report versions by storing reports in XML format. Teams can then use an XML comparer tool or a version control system to identify report changes over time. Additionally, regularly scheduled exports provide a consistent log of report iterations.
Inventory discrepancies are identified by comparing system records with physical stock counts.
Turn your data into production-ready reports instantly
Create pixel-perfect, print-ready reports with powerful exporting and zero complexity.
No credit card required.