
SAMPLE REPORT FOR DATA VISUALIZATION
Ticket Sales Analysis Report
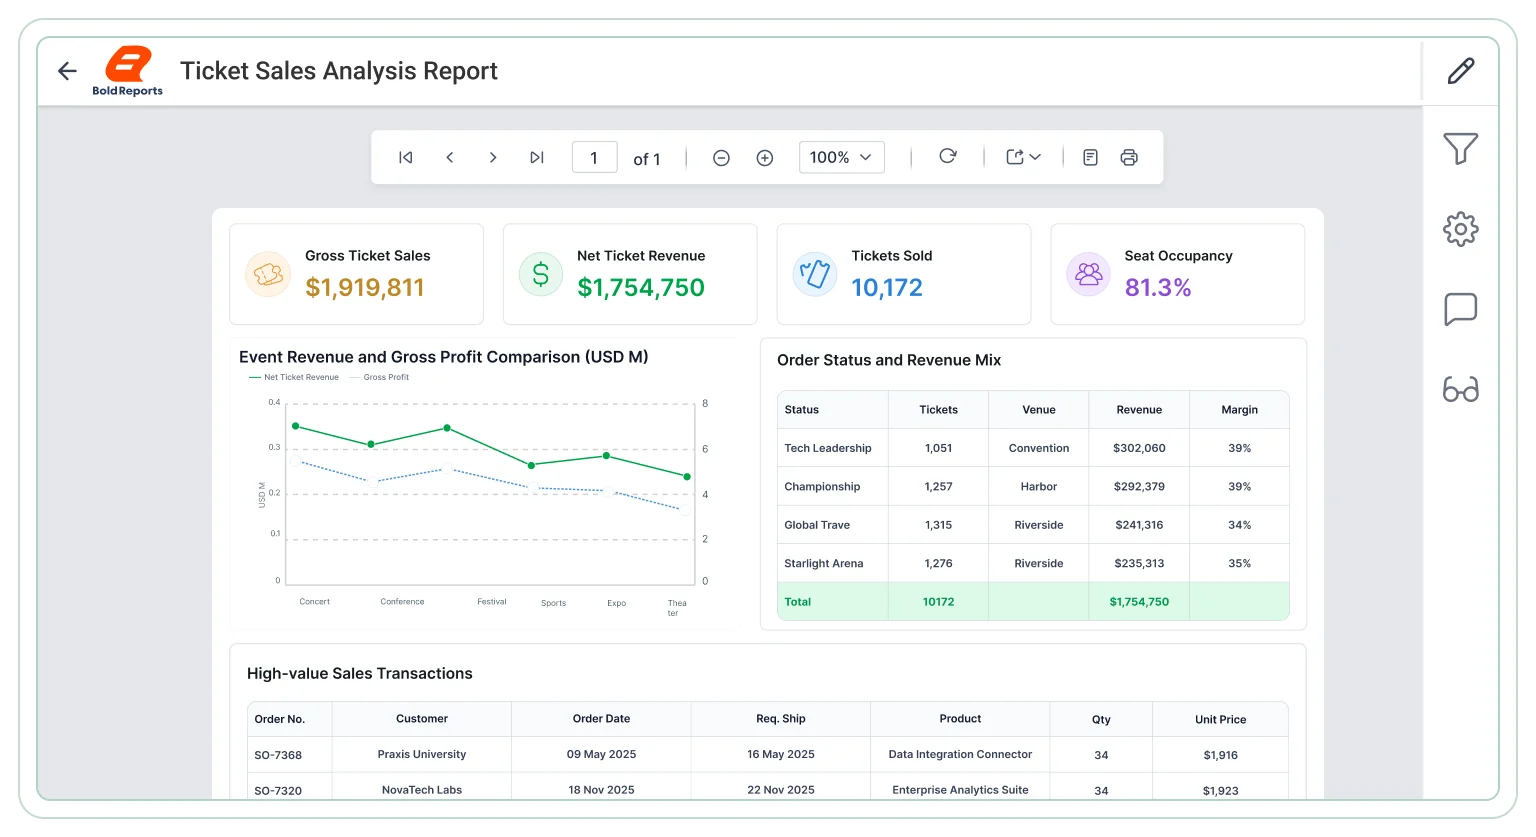
The Ticket Sales Analysis Report is a sample paginated report for sales and event teams who track ticket revenue in Bold Reports. It covers trend analysis, performance comparison, revenue patterns, event demand, booking activity, and sales distribution, and you can download it as an editable .rdl file.
Trusted by global companies








Real-world business scenarios
Explore key use cases
The Ticket Sales Analysis Report in Bold Reports supports four use cases: sales performance review, event demand analysis, booking behavior insights, and sales distribution monitoring. Teams use it to prepare export-ready reports for revenue decisions and recurring event sales reviews.
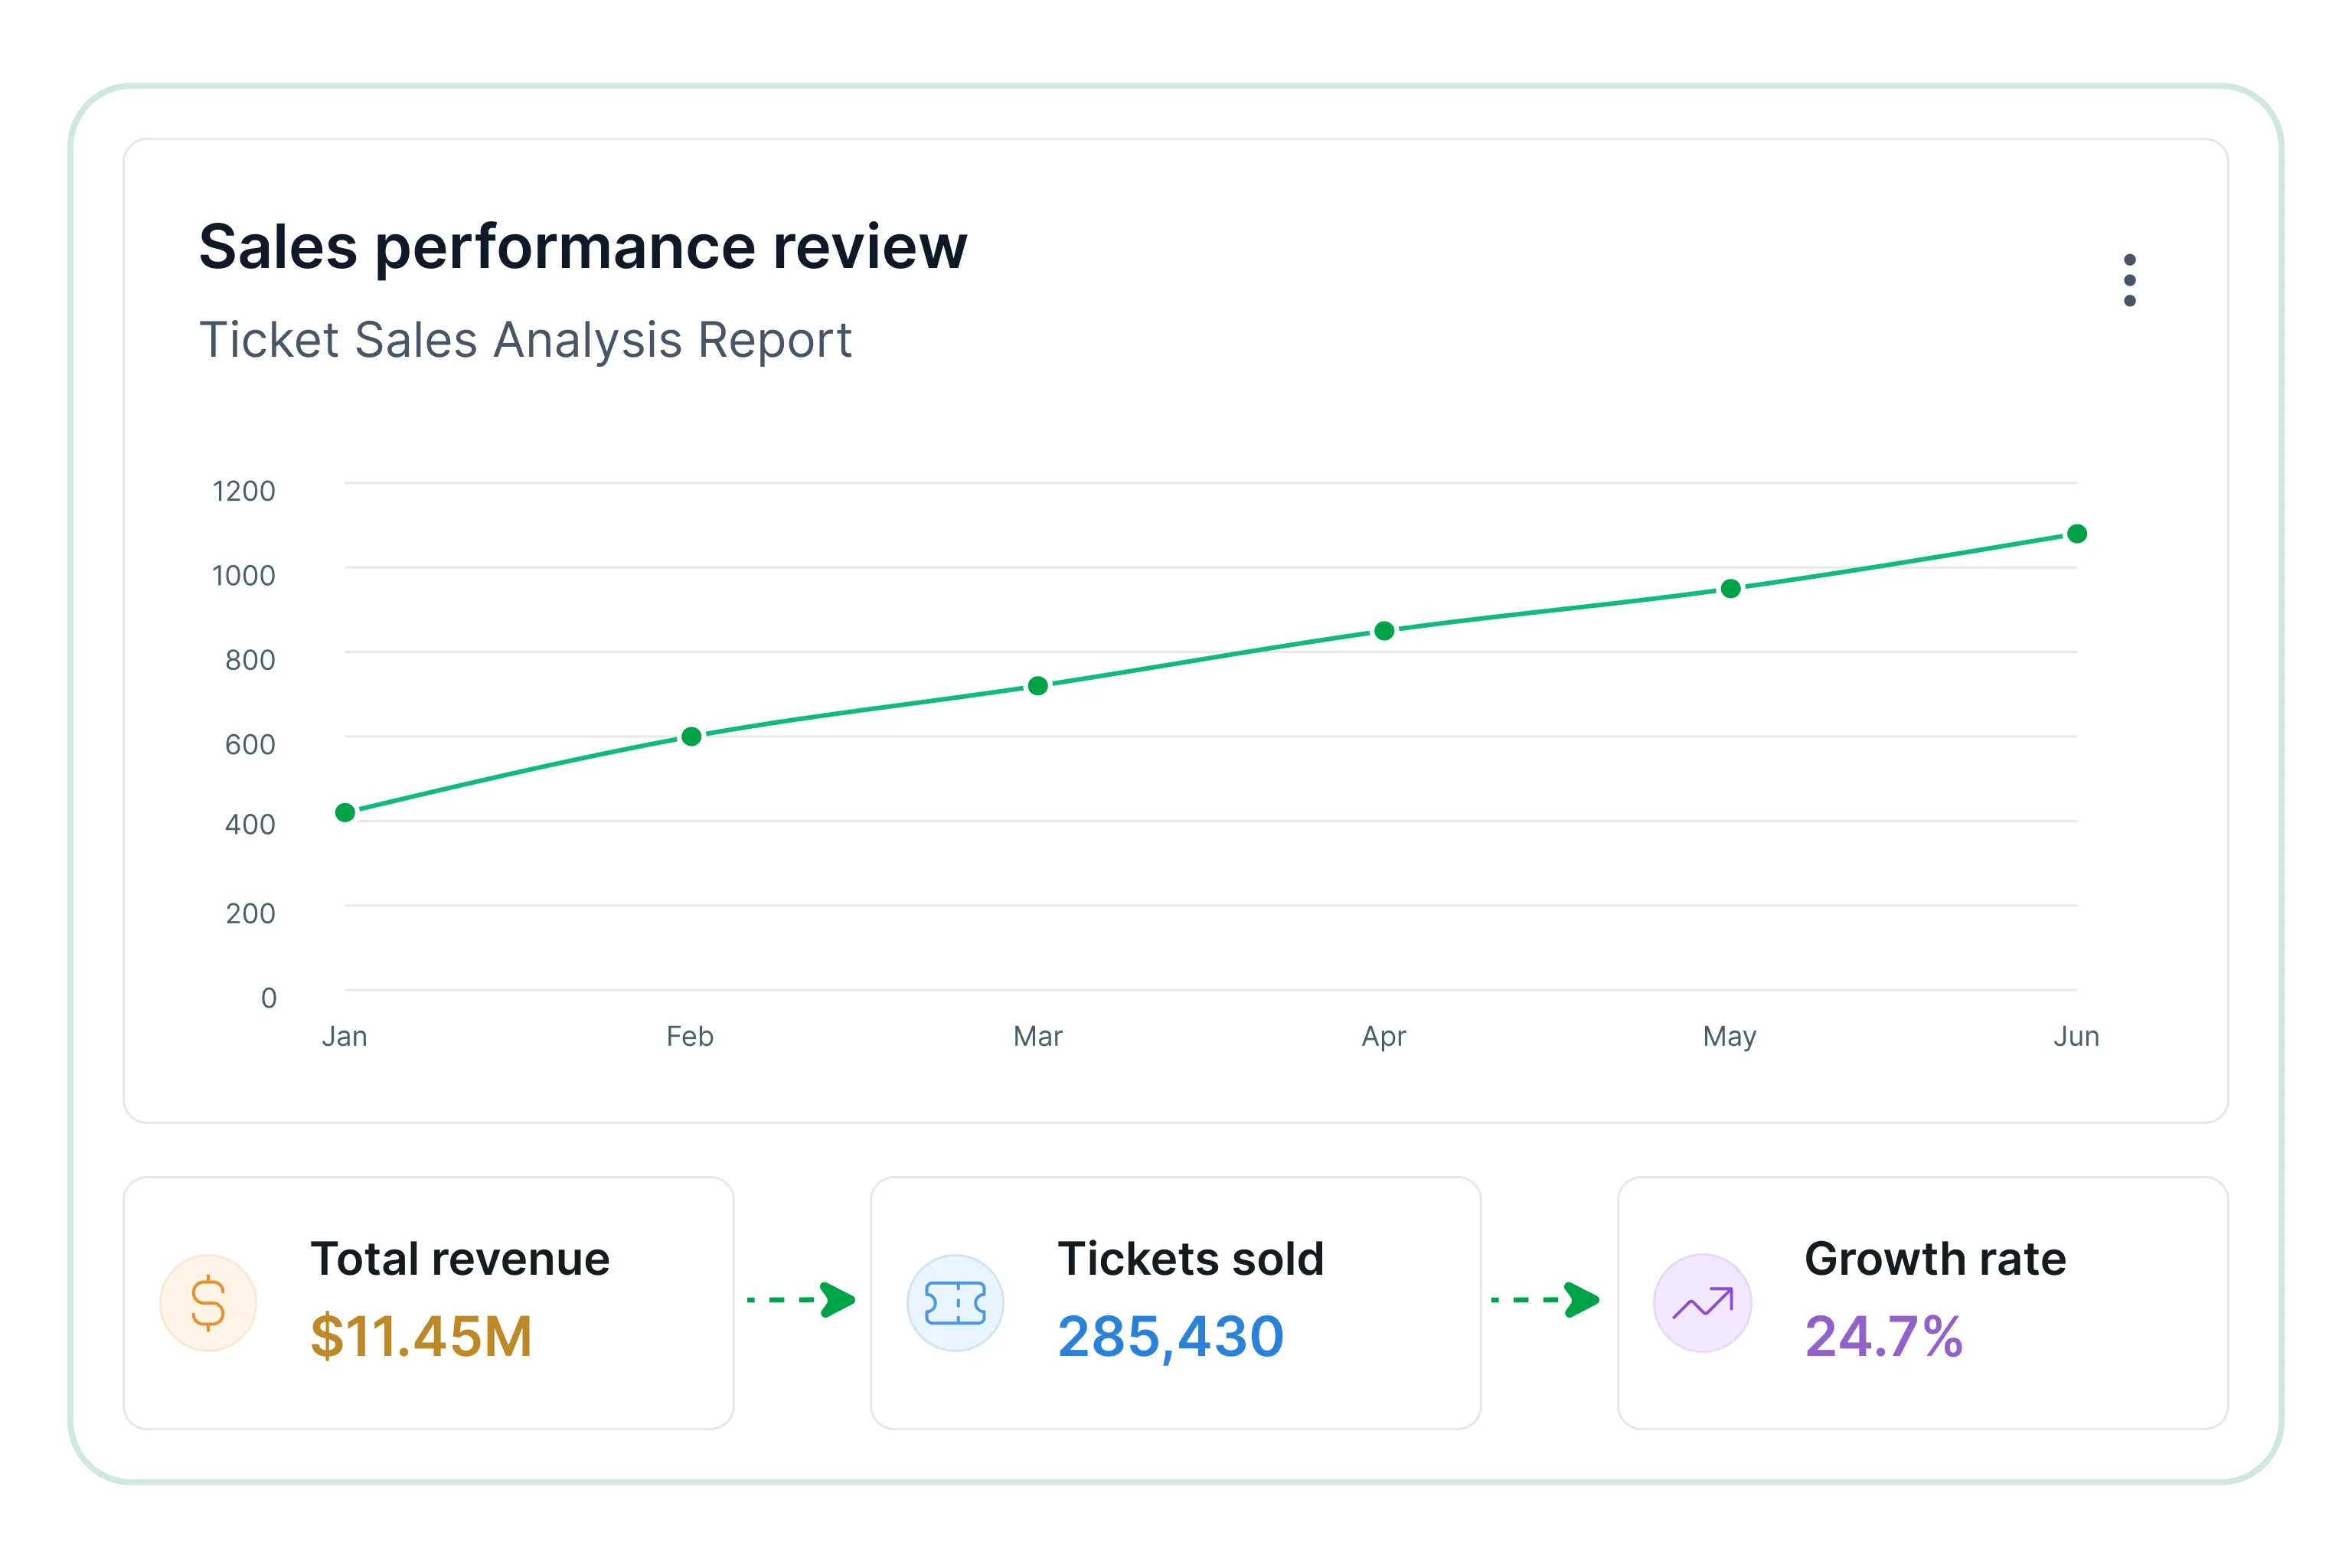
Sales performance review
Evaluate ticket revenue performance over time to identify growth trends, sales patterns, and top-performing events.
- Compare ticket revenue across reporting periods.
- Review sales performance across events.
- Identify high-performing and underperforming periods.
- Evaluate revenue contribution by event.
- Analyze overall ticket sales growth trends.
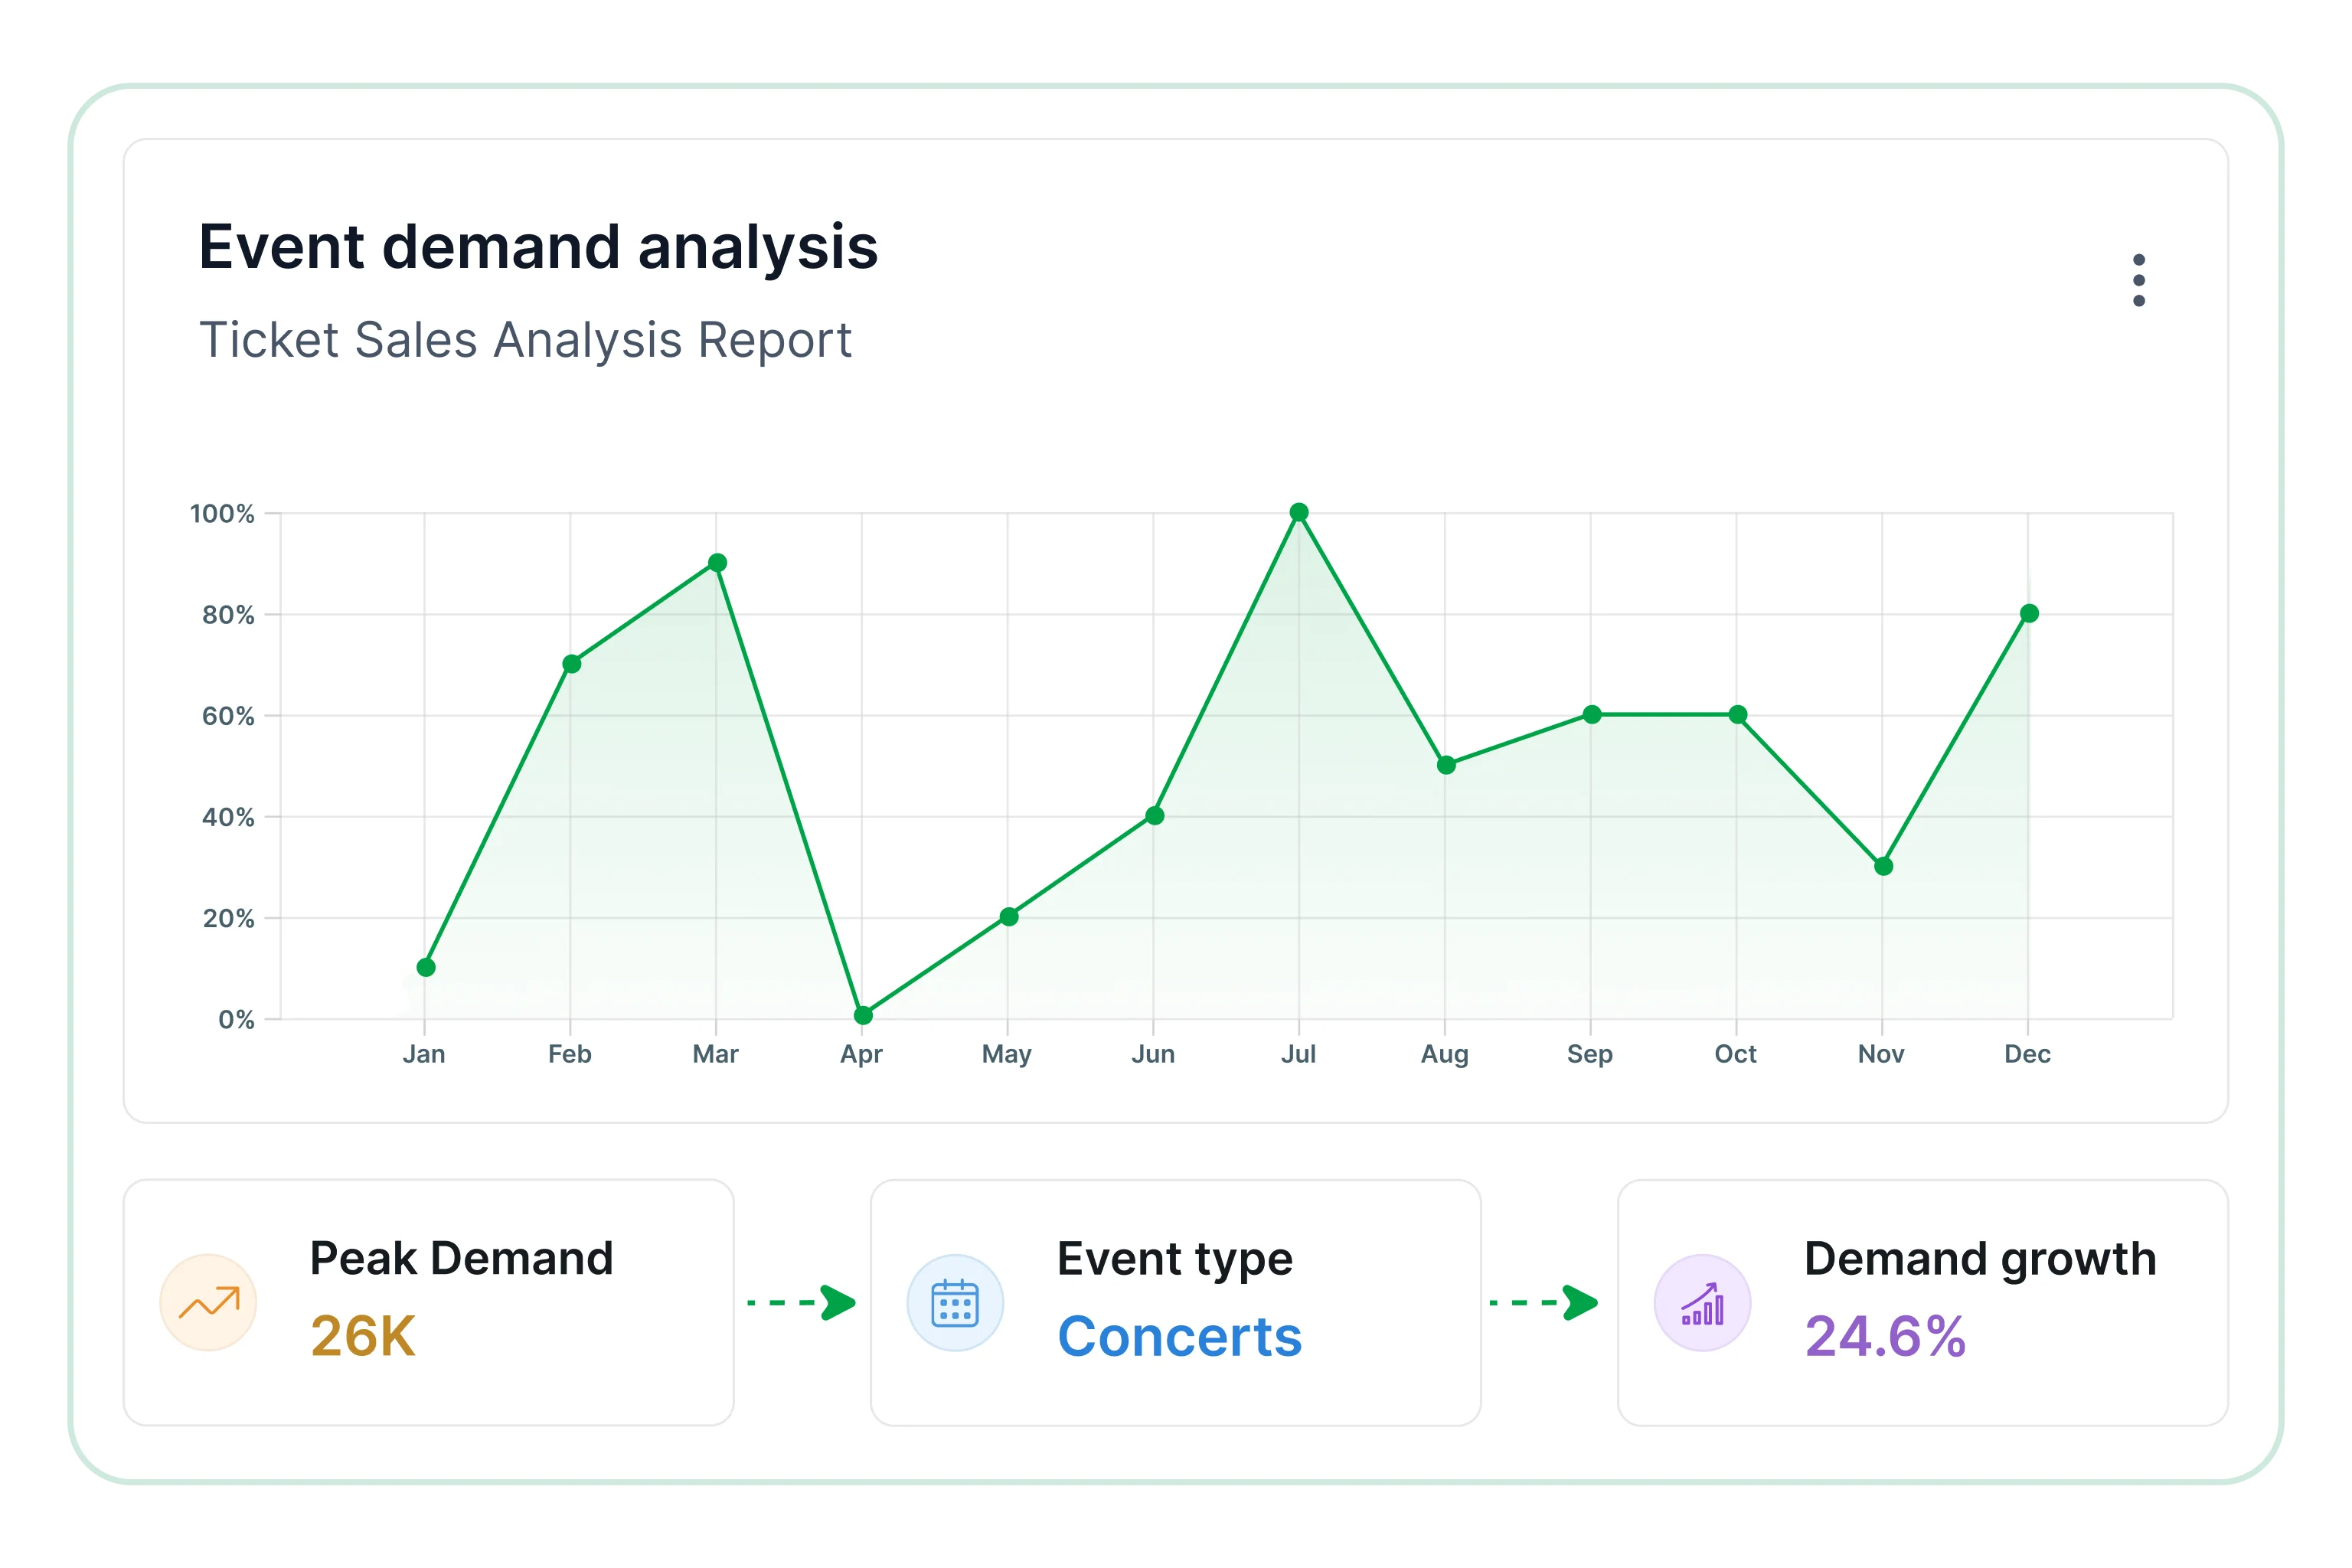
Event demand analysis
Understand demand patterns across events and categories to support planning, scheduling, and pricing decisions.
- Track ticket sales by event type.
- Compare demand across categories and schedules.
- Identify high-demand events.
- Analyze seasonal demand patterns.
- Review changes in audience interest over time.
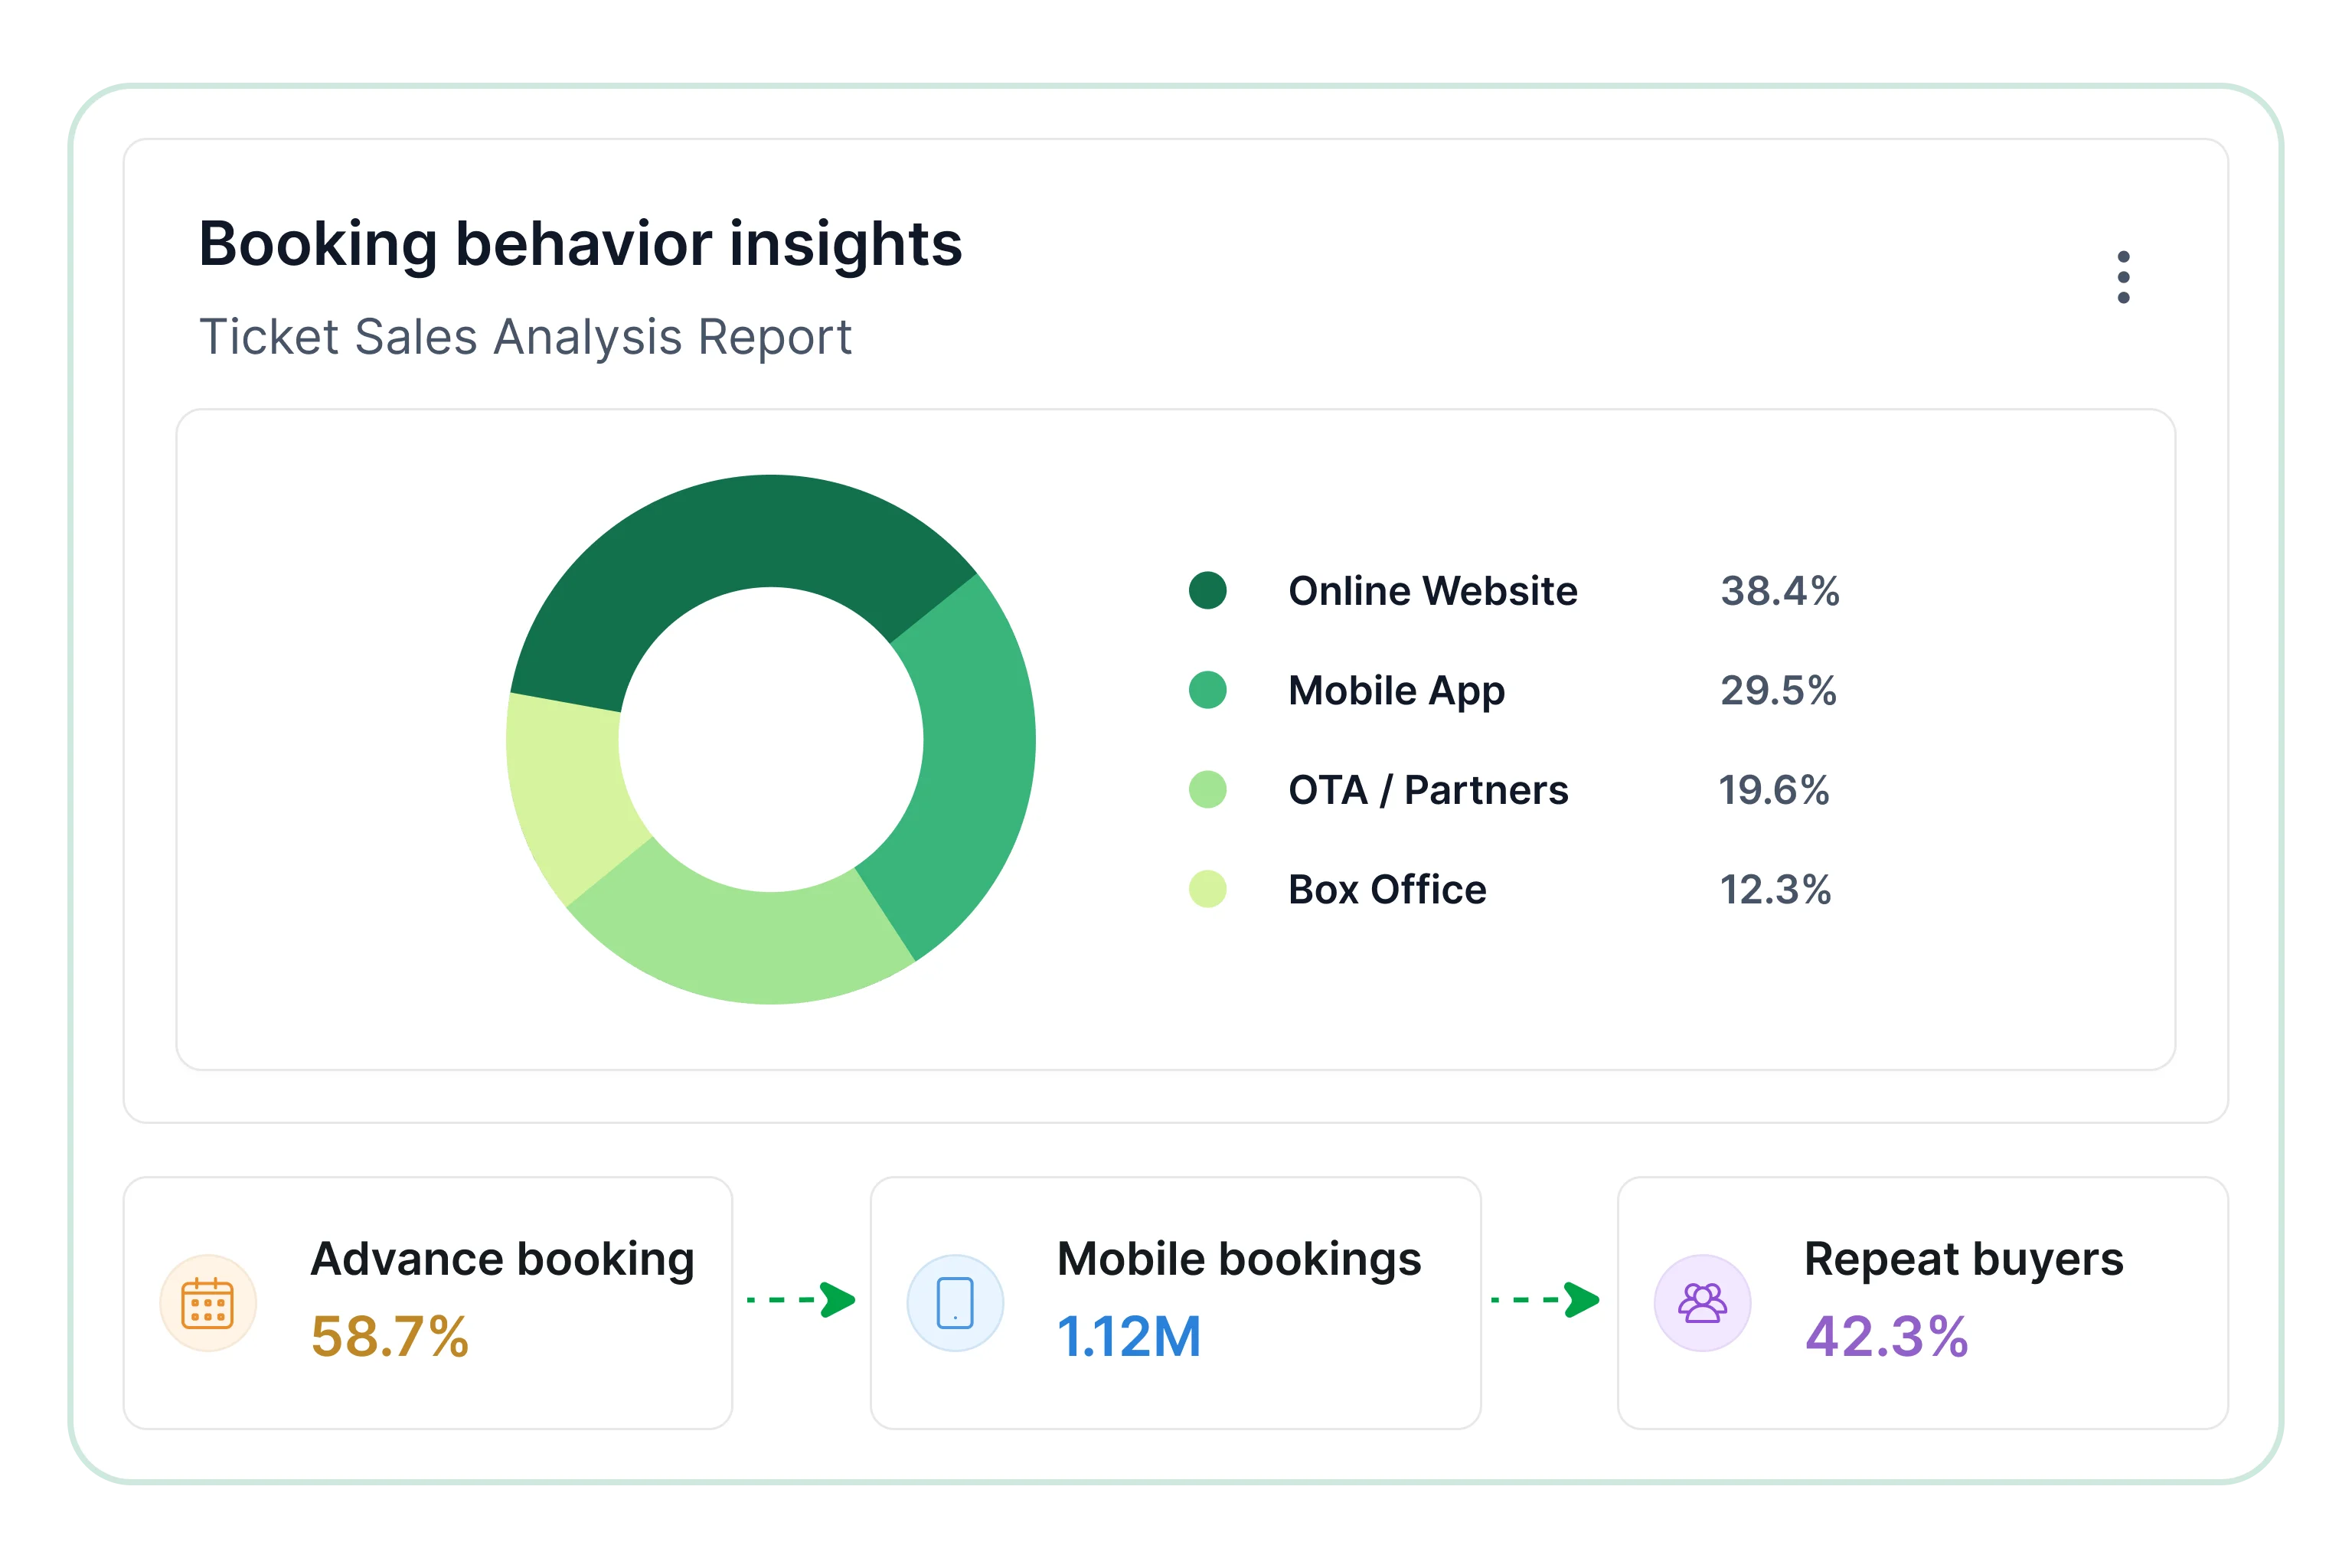
Booking behavior insights
Analyze customer purchasing behavior to better understand engagement and booking trends.
- Evaluate booking frequency and timing.
- Compare advance and last-minute purchases.
- Identify repeat customer booking patterns.
- Review attendance participation trends.
- Analyze customer engagement across events.
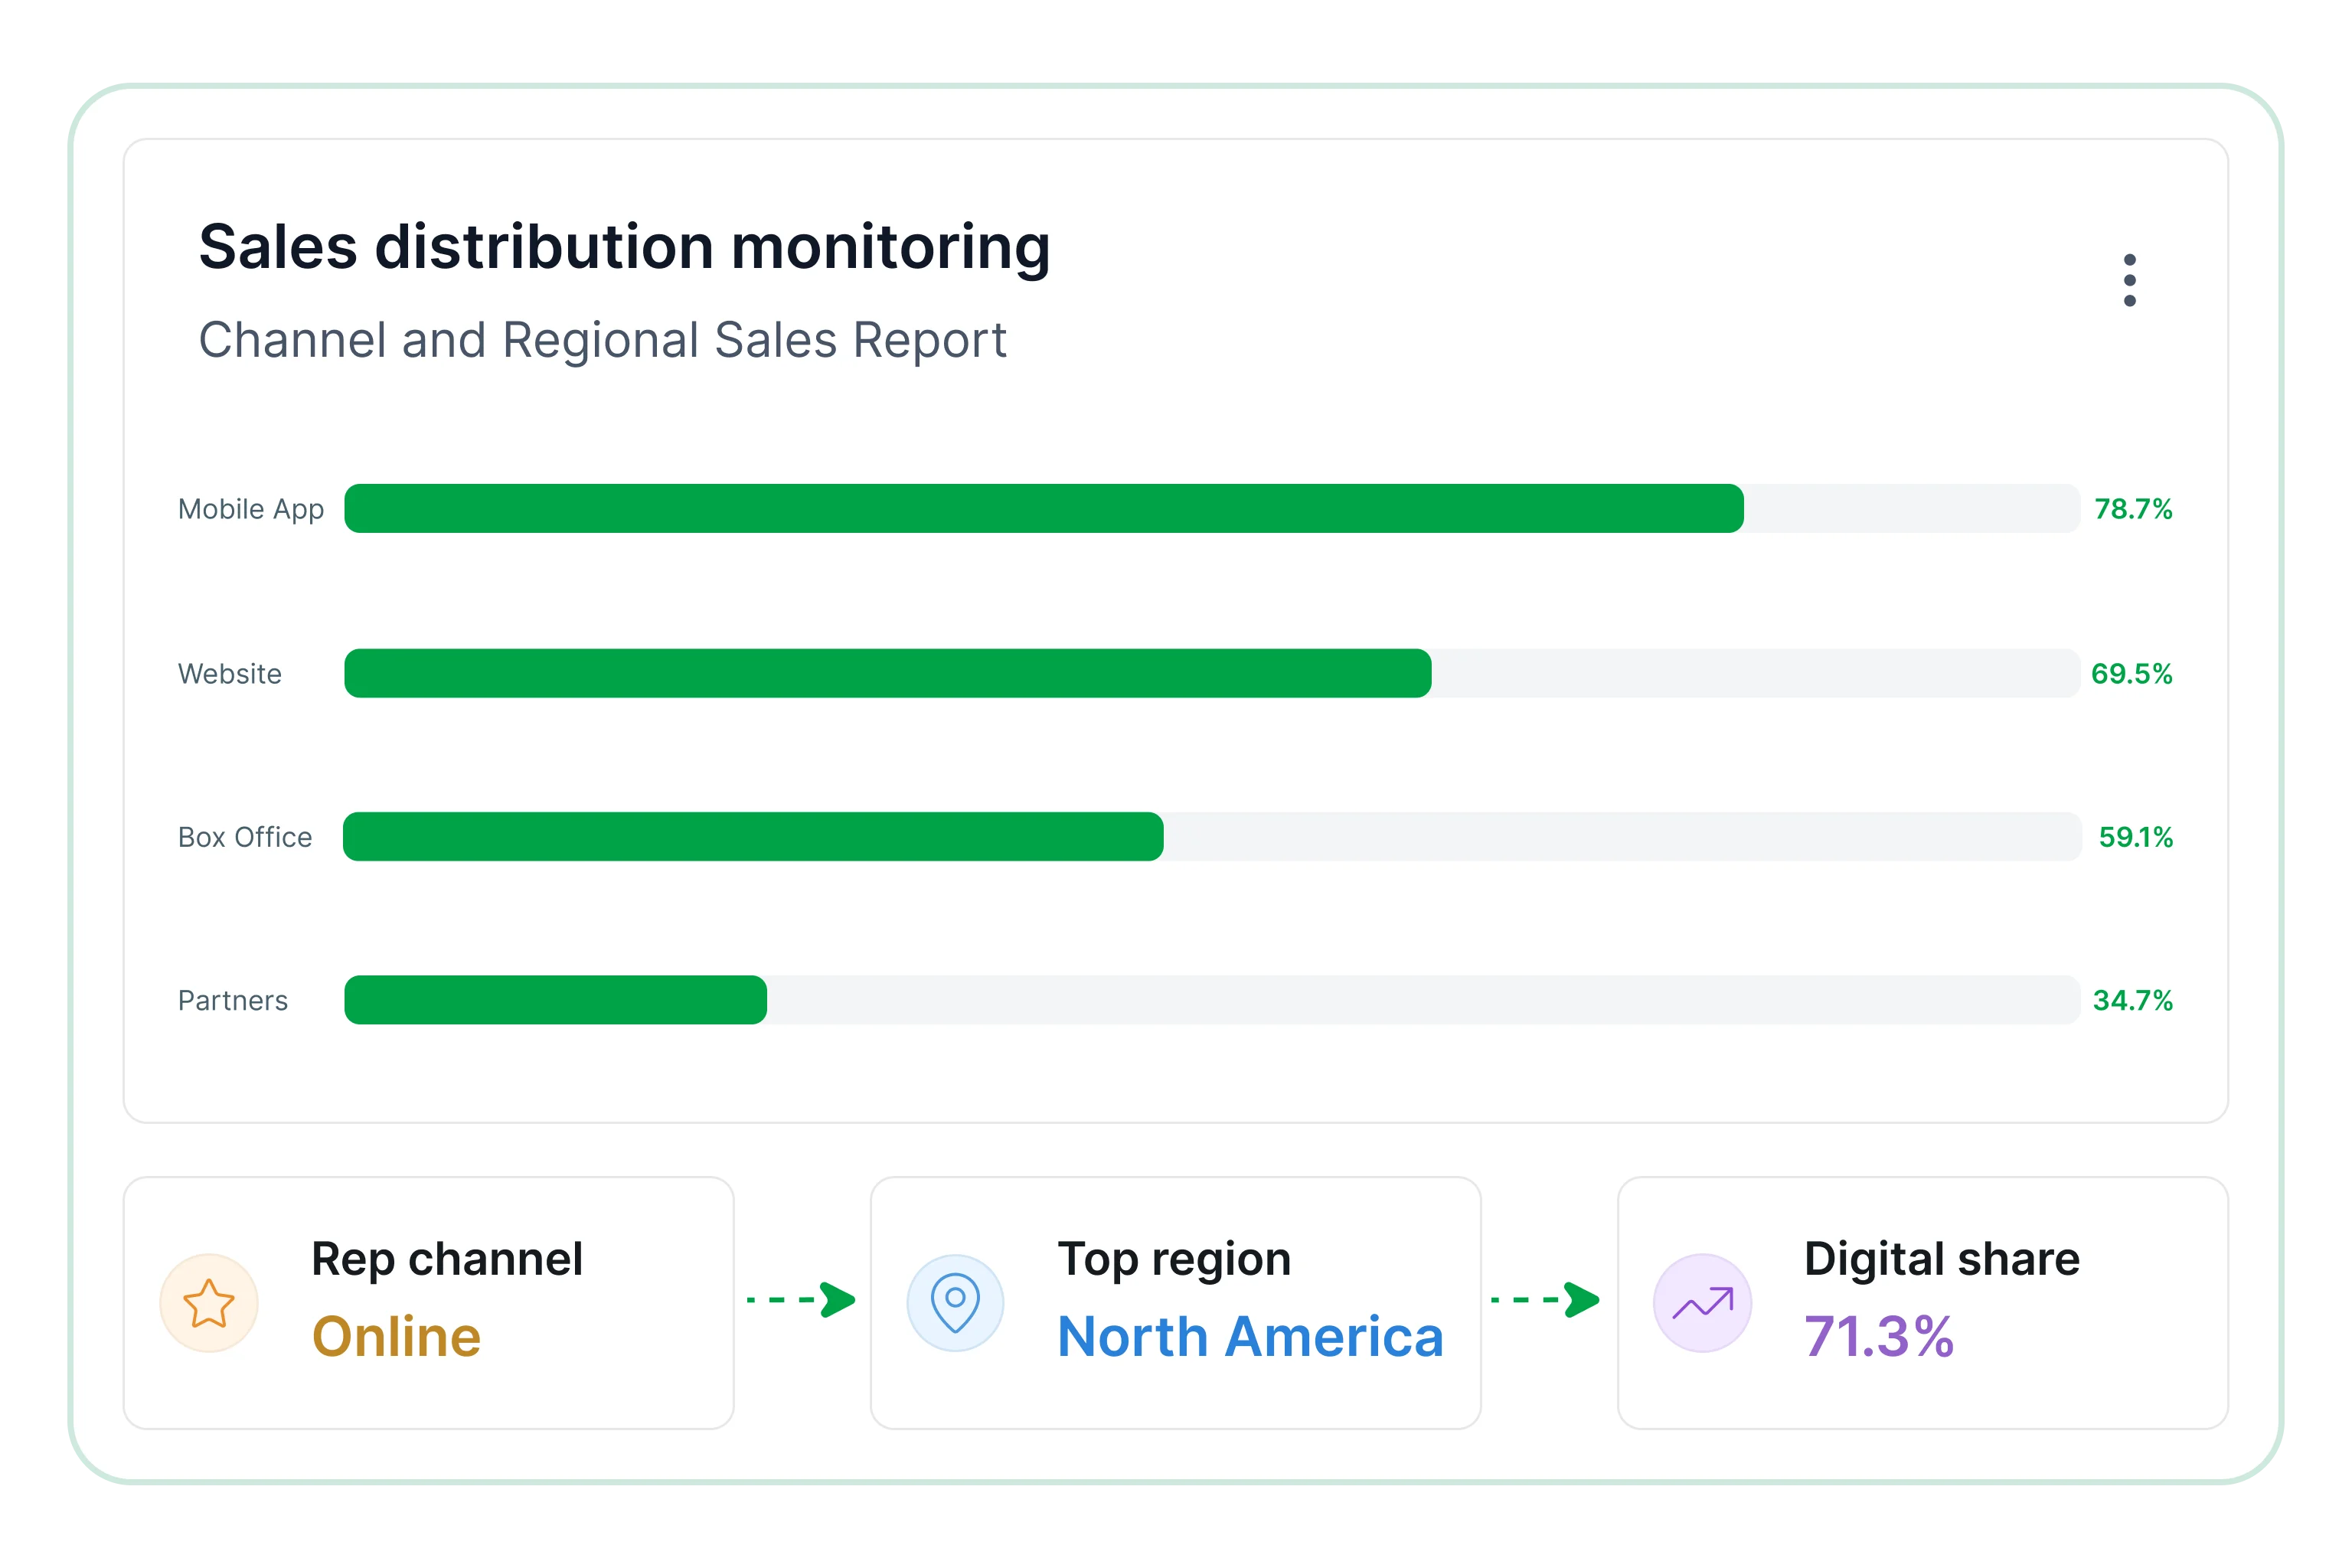
Sales distribution monitoring
Evaluate how ticket sales are distributed across channels and regions to identify strengths and growth opportunities.
- Compare sales performance across geographic areas.
- Identify high-performing sales channels.
- Evaluate regional demand differences.
- Review channel contribution to ticket revenue.
- Analyze distribution trends across reporting periods.
Review key performance indicators
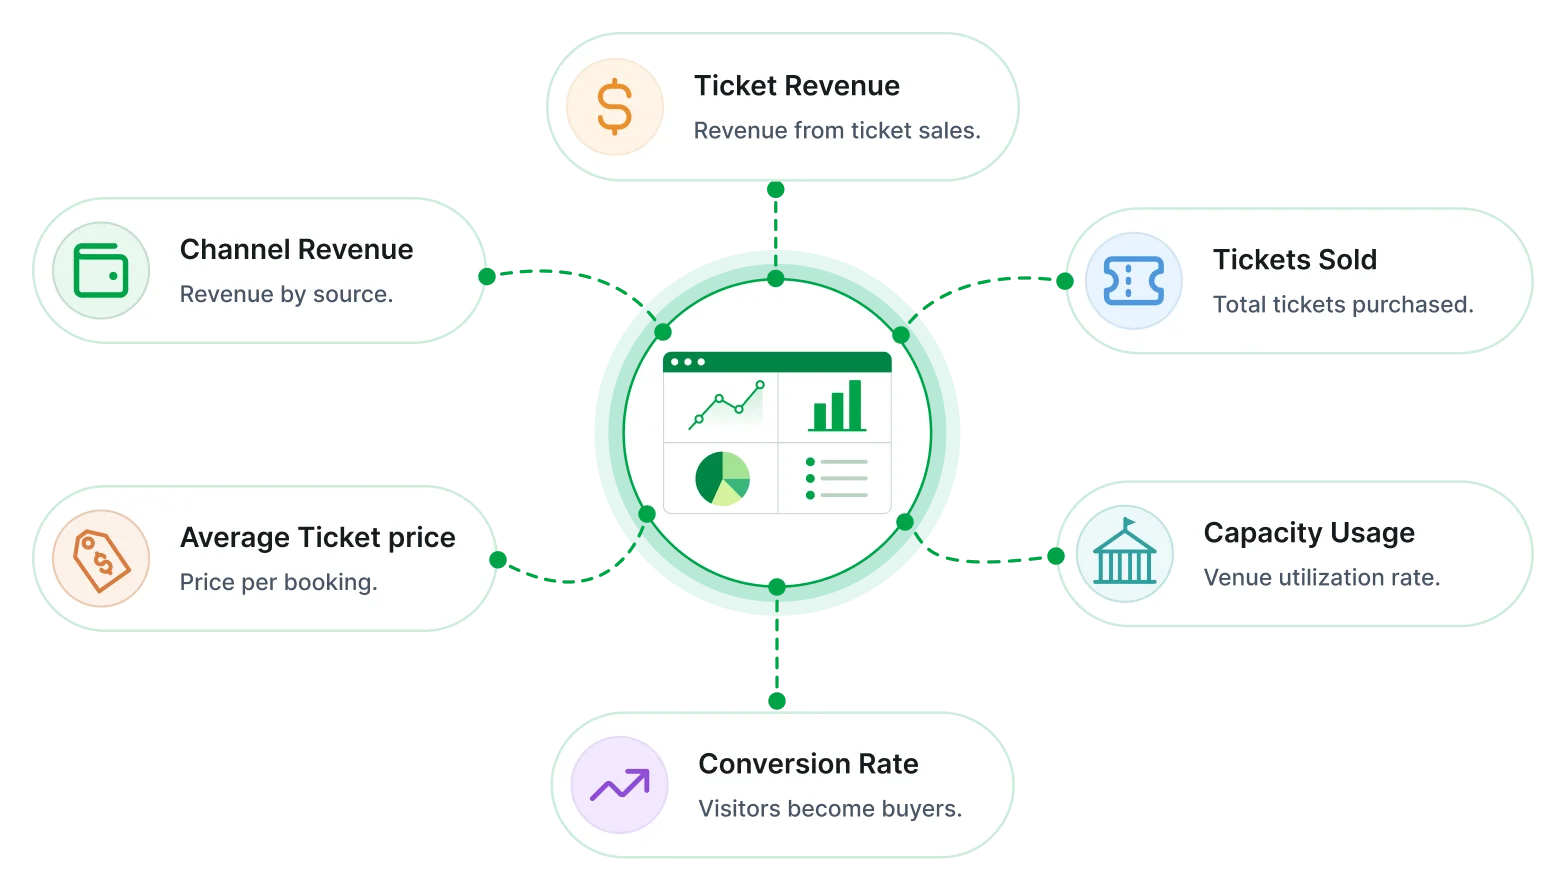
Which metrics does the ticket sales analysis report track?
The Ticket Sales Analysis Report in Bold Reports tracks metrics for ticket revenue, event demand, bookings, attendance, and sales distribution. Teams use these metrics to evaluate ticket sales performance, customer engagement, and revenue contribution across events.
Overview of this report
What is a ticket sales analysis report ?
The Ticket Sales Analysis Report is a paginated RDL report in Bold Reports that unifies ticket revenue, event demand, bookings, attendance, and sales distribution in one view. Organizations use it to evaluate event performance, understand customer behavior, and optimize ticket sales strategies.
No credit card required.
Event performance visibility
Review ticket sales activity, revenue generation, and attendance outcomes across events.
Multi-channel performance evaluation
Compare sales performance across channels, regions, and distribution networks.
Revenue and demand analysis
Understand how pricing, demand, and audience interest influence event performance.
Consistent event monitoring
Track event performance through structured reporting across recurring review periods.
Customer booking insights
Evaluate purchasing behavior, booking timing, and attendance trends.
Sales optimization support
Identify opportunities to improve pricing strategies, promotions, and event planning decisions.
Built for your team
Designed for sales and event teams
Bold Reports gives sales and event teams one report for ticket sales, event performance, audience engagement, and revenue activity, with role-based access and scheduled report delivery.
Centralized reporting
Combine ticket sales and event data into a single reporting view for consistent analysis.
Event performance analysis
Track revenue, attendance, and ticket sales activity across events to identify trends and guide decisions.
Secure and role-based access
Protect sales data with controlled permissions, ensuring only authorized users can view sensitive information.
Customer booking Insights
Evaluate purchasing behavior and audience engagement trends over time to better understand customer demand.
Automated report delivery
Schedule recurring reports to support event reviews, sales planning, and timely decision-making.
Sales distribution visibility
Compare performance across channels, locations, and event categories to uncover growth opportunities.
Tailor to your needs
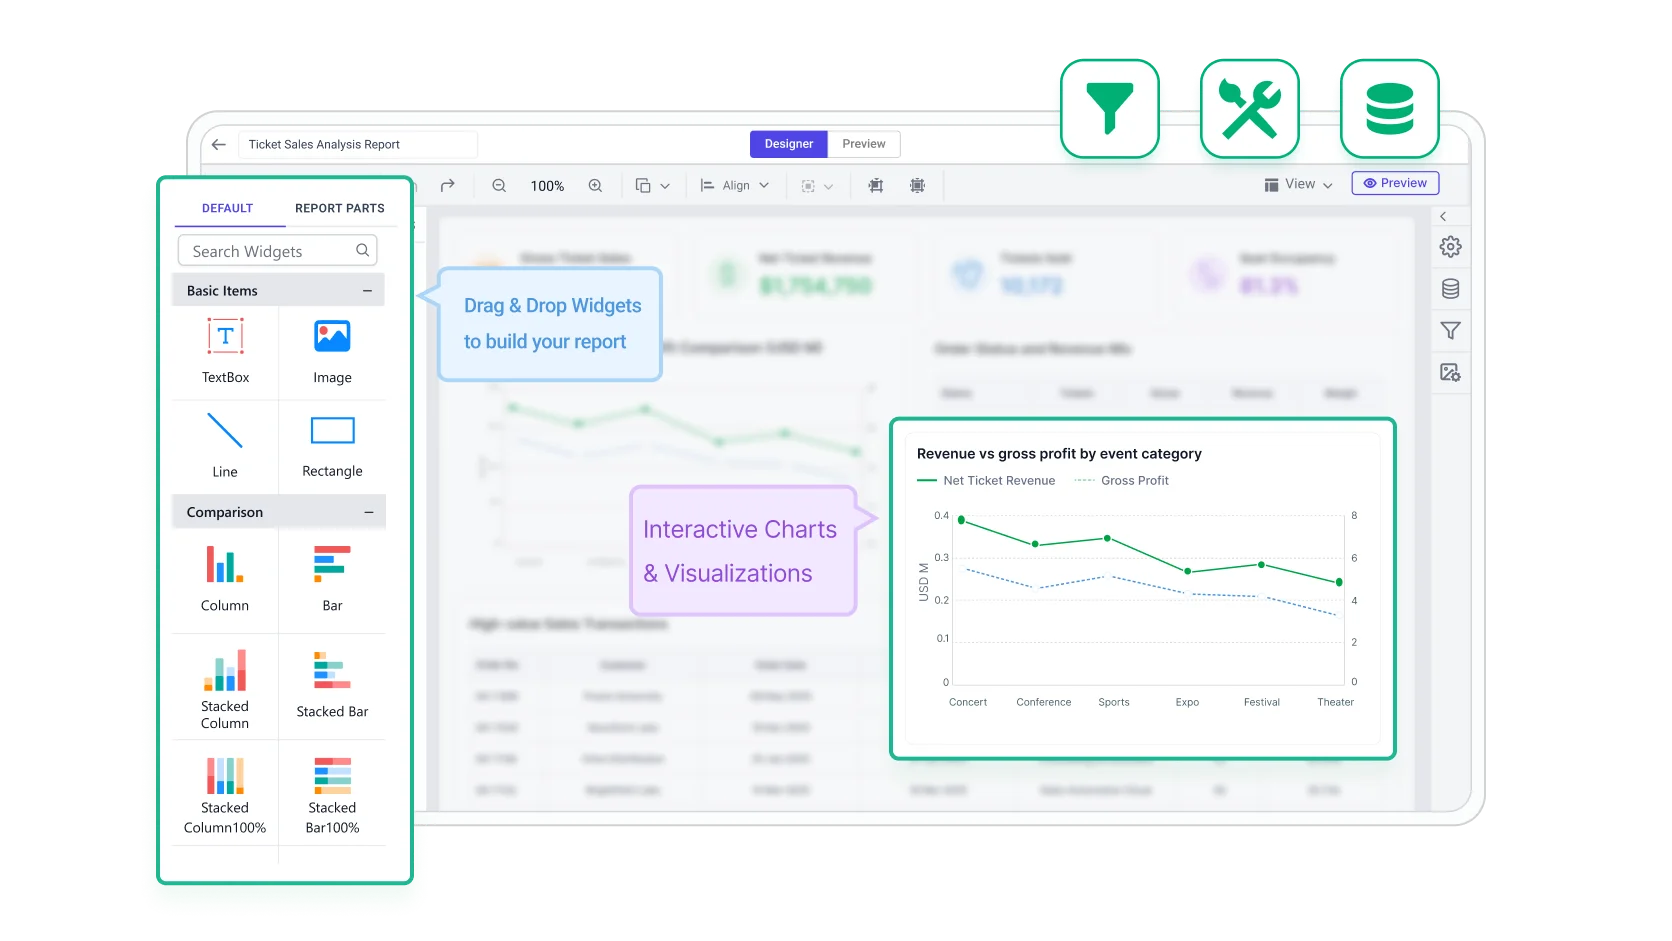
Build & customize
The Ticket Sales Analysis Report can be configured around KPIs, filters, and recurring delivery requirements. Bold Reports supports export-ready layouts and scheduled outputs for event revenue tracking and ticket sales performance analysis.
 Filter event, date, region, channels.
 Set KPIs for revenue, sales, bookings.
 Drill into bookings and transactions.
 Export reports in shareable formats.
 Schedule recurring report delivery.
No credit card required.
Templates
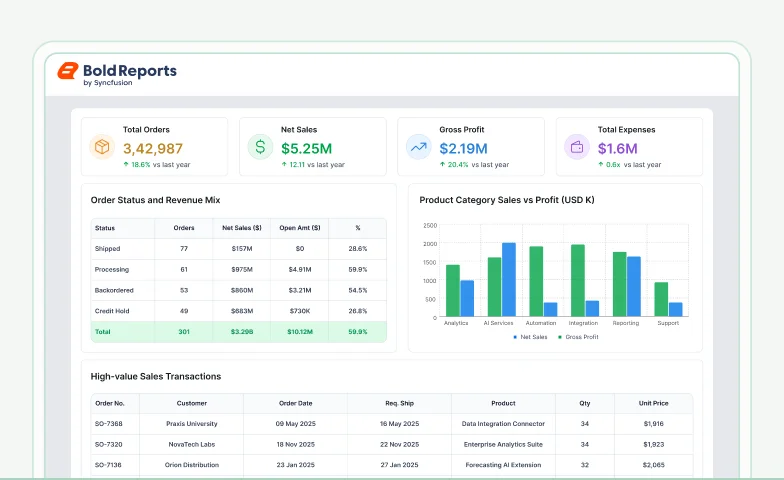
Ticket sales analysis report templates
Track sales performance, uncover trends, and support forecasting with structured, data-driven reporting for better decisions.
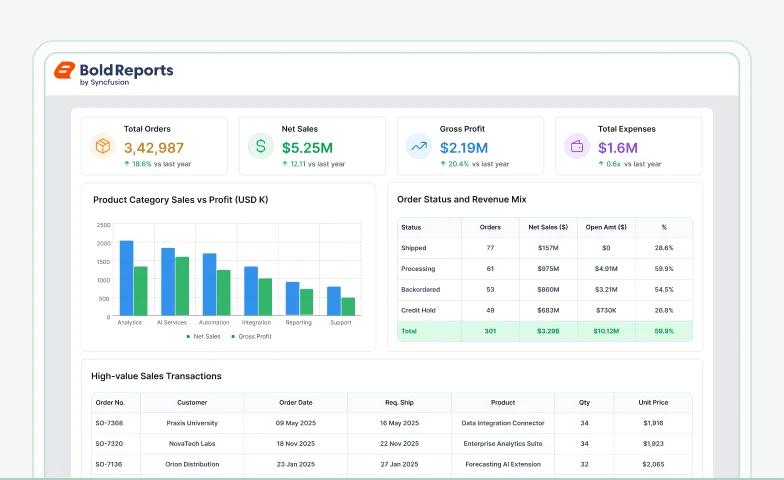
Sales Performance Report
Explore sales data to identify trends and performance drivers.
Open templateSales Analysis Report
Explore sales data to identify trends and performance drivers
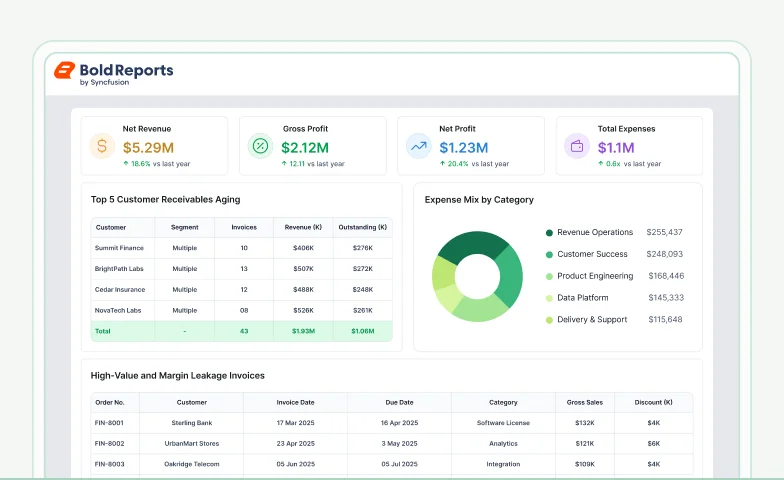
Open templateFinancial Analysis Report
Assess financial performance across revenue, costs, and profitability.
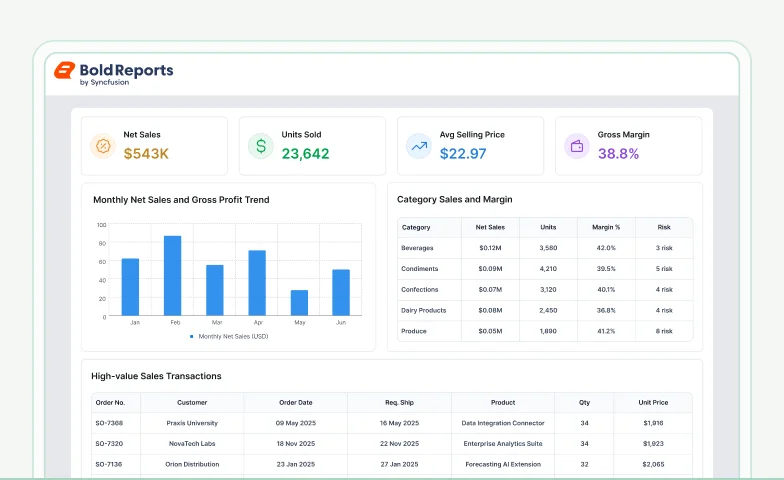
Open templateNorthwind Product & Supplier Sales Report
Understand how products and suppliers impact overall sales performance.
Open template
Connectors
Data integrations
Bold Reports lists 27 data connectors, from files and databases to web services, for flexible integration, transformation, and storage, all ready for reporting.
Common ticket sales reporting questions
Frequently asked questions
Monitor ticket sales across events, locations, and pricing tiers with detailed reports that highlight revenue patterns and audience demand.
How is attendance calculated in the report?
In the Bold Reports Ticket Sales Analysis Report, attendance can be calculated by comparing ticket validation or entry scan data with issued tickets to measure actual event turnout.
Can the report include multiple ticket sales channels?
Yes. Sales data from online, partner, direct, and third-party channels can be combined to support channel-level performance analysis.
How are refunds and voided tickets handled?
Refunds and voided tickets can be recorded as adjustments within the reporting data to ensure accurate revenue calculations.
Which export formats are available?
Bold Reports exports the Ticket Sales Analysis Report in 7 formats: PDF, Excel, Word, PowerPoint, CSV, XML, and HTML, for sharing, collaboration, and analysis.
Can reports be scheduled automatically?
Yes. Bold Reports Report Server can schedule the report to run automatically at defined intervals, helping teams maintain consistent reporting workflows. Scheduling runs on the server, so upload the .rdl file to Report Server first.
Does the report support multi-event analysis?
Yes. Ticket sales, attendance, and revenue data can be aggregated across multiple events to support broader performance evaluation and trend analysis.
Stop Exporting Data. Start Embedding Reports.
Turn your data into production-ready reports instantly
Create pixel-perfect, print-ready reports and export them in the format your team needs.
No credit card required.