TL;DR:
This SSRS migration case study shows how Si&T, an Italian IT services company, moved 600+ SSRS-created RDLC reports to .NET Core using the Bold Reports® Report Writer, an embedded reporting platform, avoiding a manual transition. For developers, the real question is which engine renders RDLC on modern .NET.
Who is Si&T and why did it choose Bold Reports?
Si&T is an IT services company in Italy's Pescara province. Its senior analyst, Andrea Amoroso, chose Bold Reports to move more than 600 RDLC reports made with SSRS to .NET Core because developers designed it for developers, onboarding was easy, and a dedicated support team was available, according to the Bold Reports customer story.
At that volume, a tool was the more efficient and cost-conscious route, so Andrea looked for one instead of relying on a manual report transition. He checked a few options online and settled on Bold Reports.
A platform change triggered the move. RDL reports run on a report server, while RDLC reports are the client-side variant, rendered inside the application, which supplies the data. Microsoft documents its Report Viewer controls for WebForms and WinForms apps, and a reply on an ASP.NET Core GitHub issue says Microsoft has no plans to develop RDLC further.
A community recompilation of the control exists for .NET Core and later, and its README says Microsoft neither supports nor develops it. For a team moving an application to .NET Core, choosing a renderer is the first decision.
What did the SSRS migration at Si&T involve?
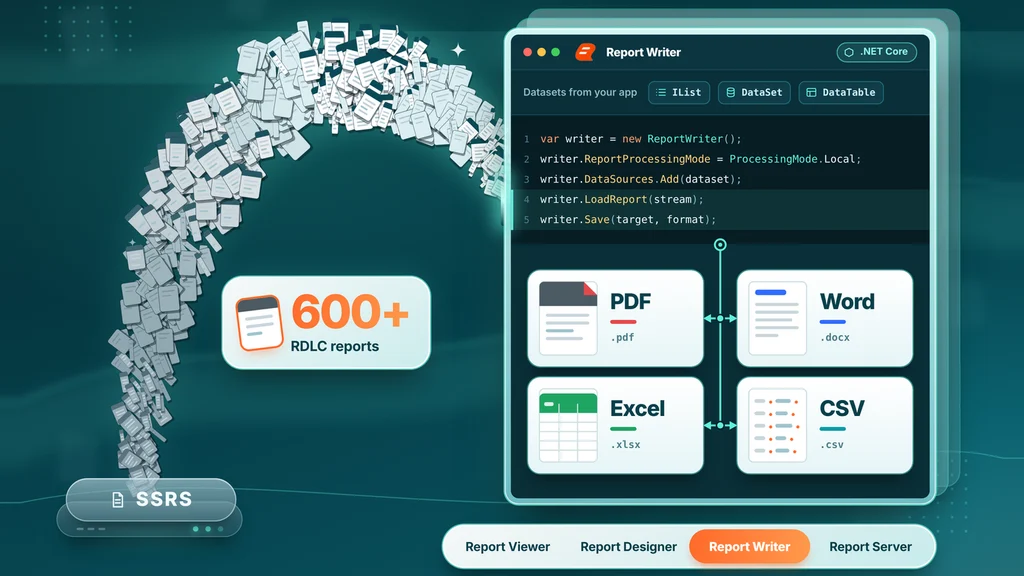
Andrea chose Report Writer, the Bold Reports component that exports finished documents from code. It loads a report definition and exports formats such as PDF, Word, and Excel without any viewer page. With it, he handled more than 600 RDLC reports after moving to .NET Core.
Si&T saved time and money, and its development team carried a lighter load. Andrea summed up the experience this way.
“The onboarding was really easy, and the support team is really nice and helpful.”
Andrea Amoroso, Senior Analyst, Si&T
How Report Writer renders RDLC reports on .NET Core
The steps below follow Bold Reports’ ASP.NET Core documentation for exporting an RDLC report and show how Report Writer works for any team.
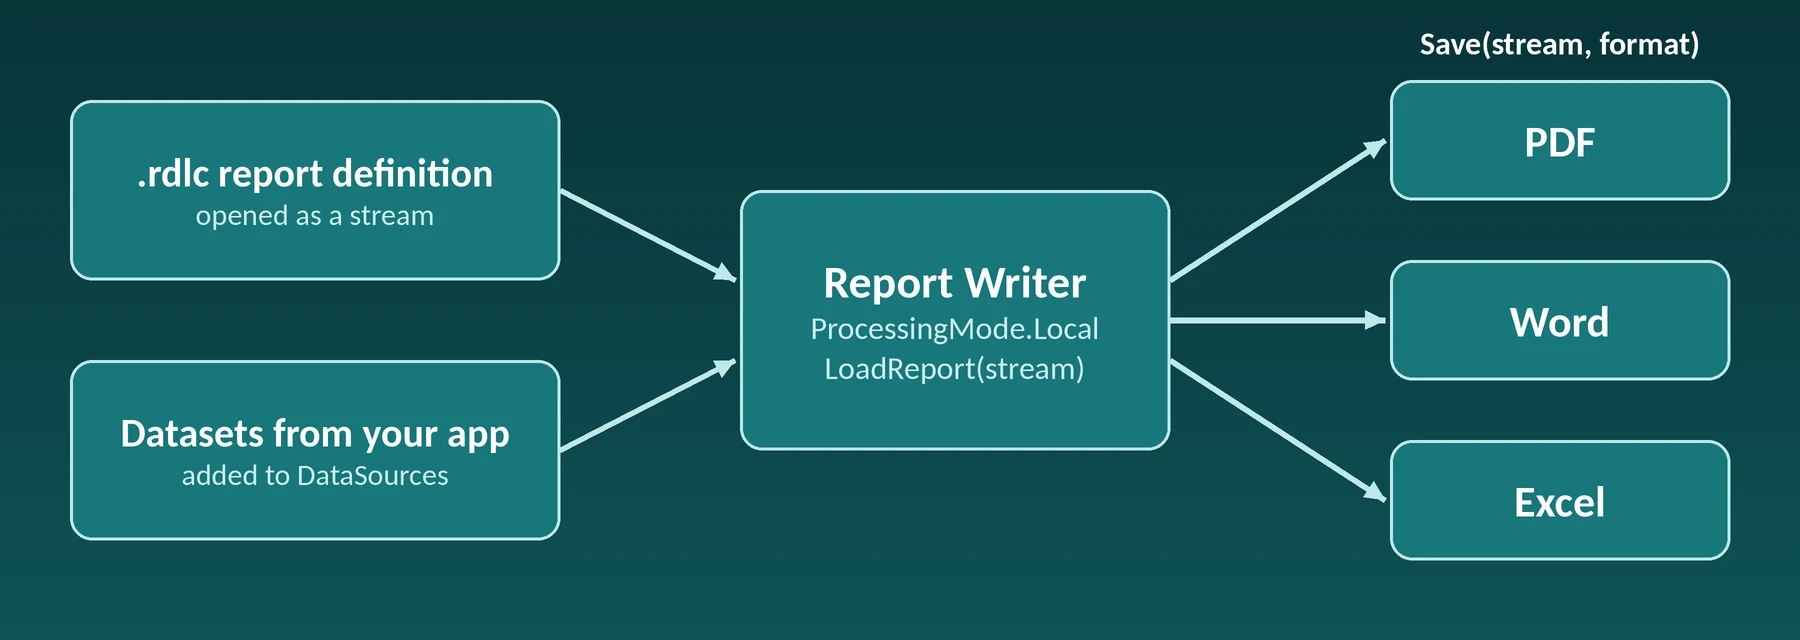
What does the RDLC export flow look like?
- Open the
.rdlcfile as a stream. - Create a
ReportWriterinstance and setReportProcessingModetoProcessingMode.Local, which tells it your application will supply the datasets. - Add each dataset to the writer’s
DataSourcescollection. TheNamemust match the dataset name in the report definition, case included, and theValueaccepts an IList, DataSet or DataTable. - Call
LoadReportwith the report stream. - Call
Savewith a target stream and a format such as PDF, Word, Excel, or CSV.
How are data sources handled?
RDLC files take their data from your application. Open one and the connection string reads /* Local Connection */ while the query text reads /* Local Query */, so your code must supply each dataset. RDL files carry data source definitions instead, either embedded in the file or in shared .rds files that must be re-pointed on the server. Bold Reports’ webinar notes on SSRS migration in .NET 10 walk through both cases.
Do SSRS expressions need to be rewritten?
Bold Reports says its engine uses the same RDL architecture as SSRS and fully supports standard VB.NET-based SSRS expressions, so you don't need to rewrite existing expressions, according to its SSRS compatibility page. Custom assemblies are the exception: the expression syntax works, but you deploy the assembly files to the Bold Reports server yourself. Test your most expression-heavy reports in both engines, using the 50+ essential SSRS expressions cheat sheet as a checklist.
Where does interactive viewing fit?
Report Writer exports documents. For interactive viewing in a browser, Bold Reports uses the Report Viewer, a separate component covered in this RDLC in ASP.NET Core Report Viewer walkthrough.
How the main SSRS migration paths compare
A manual rebuild of every report is the baseline Si&T chose to avoid. The table compares six other paths so you can weigh them for your own estate. Bold Reports is our product; the other rows rely on Microsoft documentation and each project’s own pages.
| Path | Best fit | Support position | Main limit |
|---|---|---|---|
| Stay on SSRS 2022 | Server-hosted RDL that works today, with no app change planned. | Support through January 11, 2033; no new SSRS versions (Microsoft Learn). | A report server, so it does not render RDLC inside a .NET Core app. |
| Power BI Report Server | On-premises teams wanting paginated RDL and interactive Power BI reports on one server. | Default on-premises solution from SQL Server 2025, on the Modern Lifecycle Policy (Microsoft Learn). | Needs SQL Server 2025 Enterprise or Standard, or Enterprise core licenses with active Software Assurance (SQL Server 2022 and earlier). |
| Power BI service (paginated reports) | Cloud-first teams moving SSRS or Power BI Report Server workloads to Microsoft’s cloud. | Microsoft says most standard RDL workloads can be transitioned smoothly (Microsoft Learn). | Microsoft notes that some custom implementations may require manual migration or consulting support. |
| Community Report Viewer port (reportviewercore) | Teams keeping the Report Viewer programming model on .NET 6 and later. | Community port; its README says Microsoft does not officially support it. | The README lists what doesn't work, including spatial SQL types, interactive web preview, and the WinForms designer, and documents a Wine workaround for PDF export on Linux. |
| SSRS2.NETCore | Drop-in RDLC rendering on .NET Framework 4.7.2 and 4.8 and .NET 8 to 10, including Linux and macOS. | Commercial license; first NuGet release February 10, 2026 (NuGet listing). | Trial output carries a watermark until you apply a license key; test-render your reports before committing. |
| Bold Reports (Report Writer, Report Viewer, Report Server) | Developers and ISVs rendering RDL or RDLC inside their own .NET application, as Si&T did. | Each release gets 12 months of GA and patching, then extended and limited support. | Commercial license. Custom assemblies and SSRS subscriptions don't migrate automatically, and the Web Report Designer docs list report items it cannot author, such as 3-D charts, tree maps, and TOC. |
Where each migration path wins and where it falls short
SSRS 2022 and Power BI Report Server win on fidelity and support horizon. They are Microsoft’s own engines for the RDL format, and SSRS 2022 has one documented end date, January 11, 2033. The Power BI service wins for cloud-first teams that want Microsoft to run the infrastructure. Bold Reports’ Power BI vs. SSRS guide compares those Microsoft options in more depth, and its Bold Reports vs. SSRS guide is a developer’s guide to switching.
For rendering inside your own code, the choice narrows to the community port, SSRS2.NETCore and Bold Reports. The community port keeps the Report Viewer programming model and documents Linux and macOS support, with a Wine workaround for some formats. SSRS2.NETCore documents Linux, macOS, and Docker support on its NuGet page, so compare both with Report Writer’s documented platform support. Bold Reports publishes a release lifecycle, which means you should plan regular upgrades.
What should you check before migrating hundreds of RDLC reports?
Check four things before cutover: where each report renders, which report items and data sources the target documents mark as unsupported, whether output matches at scale, and the rollout order. These are general guidelines for teams moving large estates of RDLC reports.
- Sort reports by where they render. RDLC files that render inside an application need an in-process renderer, such as Report Writer for exports or the Report Viewer for interactive display. RDL files on a report server have more options, including Power BI Report Server and Bold Reports Report Server. For server-to-server moves, Bold Reports documents PowerShell scripts and REST APIs to transfer reports, shared data sources, and datasets, and its SSRS compatibility page notes that custom assemblies and subscription schedules don't carry over automatically.
- Check each report against documented limits. The Web Report Designer documentation lists report items it cannot author, including 3-D charts, sunburst, tree map, bullet graph, heat map, Gantt, shapes, checkbox, and TOC, and data sources it does not support, including SharePoint List and SAP. Those limits apply to authoring in the designer. How existing RDLC files render in the Viewer or Writer is a separate question, so test-render any report that uses these items.
- Validate output at scale. Render each report with production parameters through the current renderer and the new one, export both to PDF, compare page counts and totals, then check layout by eye. Review the differences by hand, starting with the reports people use most.
- Roll out in waves. Move one module’s reports first, run old and new output side by side, and retire the old path only after the people who read the reports sign off. For the application side of the move, the .NET Core migration tutorial walks through migrating an SSRS .NET app to .NET Core. If your estate also holds Crystal Reports files, Bold Reports’ Crystal Reports migration guide lays out the same wave-based pattern in eight steps, from inventory and a pilot to a parallel run and cutover.
Can a script inventory your RDL and RDLC files?
Yes. This Python script reads every .rdl and .rdlc file in a folder, tallies their schema years, data source styles, and items that need a closer look, and lists the datasets each RDLC file expects, so you see the shape of an estate before you test-render anything. It needs only Python 3 and its standard library.
#!/usr/bin/env python3
"""Inventory RDL and RDLC files: schema, data source style, items to review."""
import collections, pathlib, sys
import xml.etree.ElementTree as ET

def tag(el):
    return el.tag.rsplit('}', 1)[-1]

def is_true(el):
    return (el.text or '').strip().lower() == 'true'

def scan(path):
    root = ET.parse(path).getroot()
    info = {'file': path.name, 'kind': path.suffix.lower().lstrip('.'),
            'schema': root.tag.split('}')[0].split('/')[-3],
            'sources': set(), 'datasets': [], 'flags': set()}
    for el in root.iter():
        t, text = tag(el), (el.text or '').strip()
        if t == 'DataSourceReference':
            info['sources'].add('shared')
        elif t == 'ConnectString':
            local = text == '/* Local Connection */'
            info['sources'].add('local' if local else 'embedded')
        elif t == 'DataSet':
            info['datasets'].append(el.get('Name'))
        elif t == 'Subreport':
            info['flags'].add('subreport')
        elif t == 'CustomReportItem':
            info['flags'].add('custom item')
        elif t == 'Code' and text:
            info['flags'].add('code block')
        elif t == 'ChartThreeDProperties':
            if any(tag(c) == 'Enabled' and is_true(c) for c in el):
                info['flags'].add('3-D chart')
    return info

def main(folder):
    rows = []
    for path in sorted(pathlib.Path(folder).rglob('*')):
        if path.suffix.lower() in ('.rdl', '.rdlc'):
            try:
                rows.append(scan(path))
            except ET.ParseError as err:
                print('skipped', path.name, err)
    count = lambda key: dict(collections.Counter(r[key] for r in rows))
    sources = collections.Counter(s for r in rows for s in r['sources'])
    flags = collections.Counter(f for r in rows for f in r['flags'])
    print(f"{len(rows)} files: {count('kind')}")
    print('schema year:', count('schema'))
    kinds = ('embedded', 'shared', 'local')
    print('data sources:', {k: sources.get(k, 0) for k in kinds})
    print('files to review:', dict(flags))
    for r in rows:
        if r['kind'] == 'rdlc':
            print(f"  {r['file']}: supply dataset(s) {', '.join(r['datasets'])}")

if __name__ == '__main__':
    main(sys.argv[1] if len(sys.argv) > 1 else '.')
When run against the 152 RDL and RDLC files in Bold Reports’ public resources repository (commit 2ccb201, October 13, 2026), it printed the following. These are tutorial reports, not a production estate, so read the numbers as a sample of the output.
152 files: {'rdl': 149, 'rdlc': 3}
schema year: {'2016': 122, '2010': 30}
data sources: {'embedded': 139, 'shared': 0, 'local': 3}
files to review: {'code block': 2, 'custom item': 9, 'subreport': 4}
  ProductList.rdlc: supply dataset(s) list
  design-rdlc-report.rdlc: supply dataset(s) Sales
  product-list.rdlc: supply dataset(s) list
A second public sample, the five AdventureWorks-based SSRS reports in curtild/SSRS-Projects (commit 4ffe504), shows the opposite data source profile.
5 files: {'rdl': 5}
schema year: {'2016': 5}
data sources: {'embedded': 0, 'shared': 5, 'local': 0}
files to review: {}
All five reports reference a shared data source, so a server-to-server move requires repointing five connections, whereas the Bold Reports sample has none. The three RDLC files in the first sample show what your code owes Report Writer: a dataset named list for the two Product List reports, which matches the name in the export documentation, and Sales for the third. The schema line shows which RDL versions an estate uses, and the review line shows where to test-render first: subreports, code blocks, and custom report items. Extend the script to flag the designer’s unsupported items file by file.
SSRS 2022 is supported through January 11, 2033
Microsoft’s Reporting Services consolidation FAQ says Microsoft will release no new versions of SSRS and that Power BI Report Server becomes the default on-premises reporting solution starting with SQL Server 2025. SSRS 2022 will continue to receive security updates and support through January 11, 2033, and can use later SQL Server Database Engine versions to host its catalog (checked October 13, 2026).
Power BI Report Server is an on-premises report server that hosts paginated RDL reports and interactive Power BI reports, and Microsoft says it fully supports existing RDL reports. It is a server you deploy and browse to, not an SDK you call from your own code. For developers and ISVs who need to render RDL or RDLC inside their own application, that is the gap, and it is why a server-to-server move does not answer the question Si&T faced.
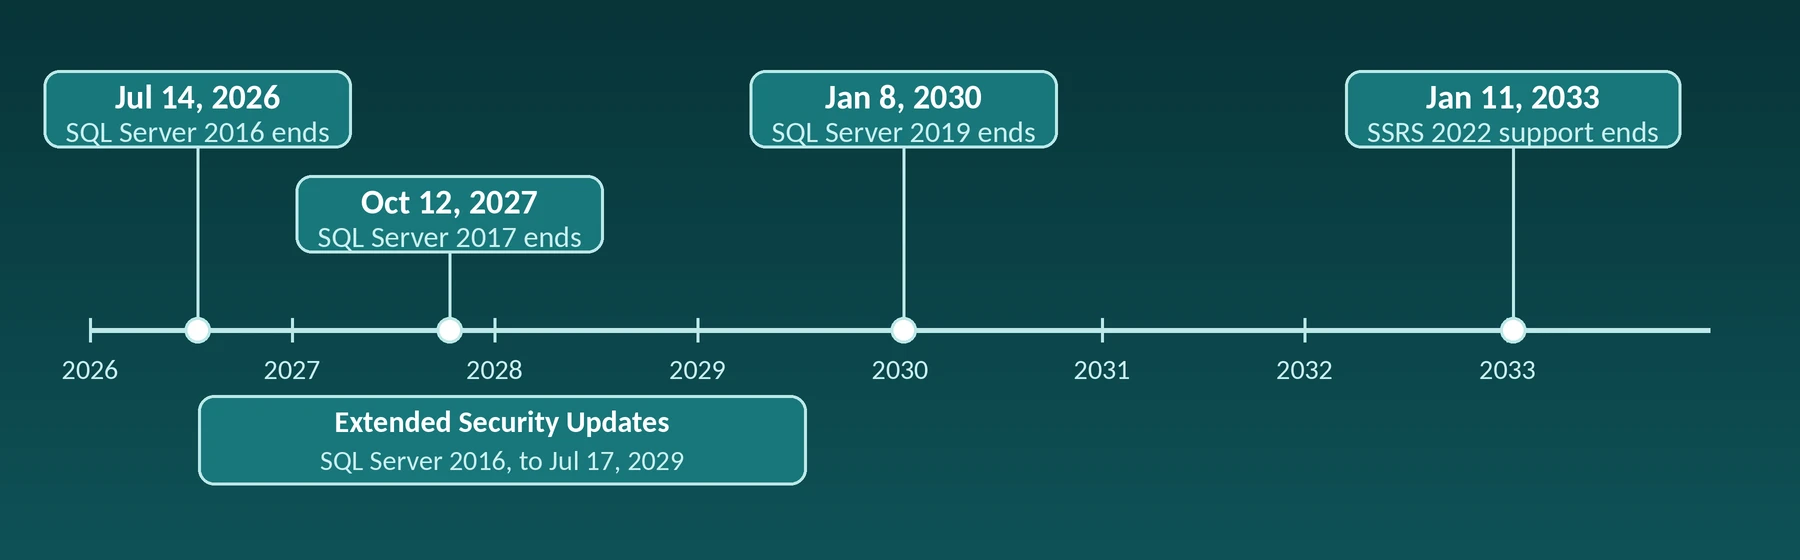
The SQL Server version under your reports sets a separate clock. SQL Server 2016 reached the end of extended support on July 14, 2026, and Microsoft also offers Extended Security Updates through July 17, 2029. SQL Server 2017 follows on October 12, 2027, and SQL Server 2019 on January 8, 2030 (Microsoft Lifecycle, checked October 13, 2026). After these dates, security patches and Microsoft support end, but the software keeps running.
Bold Reports’ SQL Server 2025 SSRS migration guide covers the footprint audit, what carries over, and the three main migration risks for teams planning a move.
Should you migrate now or wait?
Migrate now if your RDLC reports must run inside an application moving to .NET Core, or if they run on SQL Server 2016 or earlier. You have runway if your server-hosted RDLs run on SSRS 2022, supported through January 11, 2033.
Move now if any of these apply.
- Your application is moving to .NET Core or later, and your reports are RDLC files rendered through Microsoft’s WebForms or WinForms Report Viewer controls.
- Your reports run on SQL Server 2016 or earlier, which is past extended support, and you cannot take Extended Security Updates or move the server first.
- You are an ISV that needs RDL or RDLC rendering inside your own product, which a standalone report server does not provide.
You have runway if any of these apply.
- Your reports are server-hosted RDL on SSRS 2022, which is supported through January 11, 2033, and no application change is planned.
- Your licensing already includes Power BI Report Server rights, through SQL Server 2025 Enterprise or Standard or Enterprise core licenses with active Software Assurance, and you are comfortable running it as your report server.
- You do not need to render reports inside your own code.
Before choosing a path, run the inventory script, test-render the reports it flags, and count how many of your RDLC reports render unchanged on the new engine. Mostly unchanged reports favor an engine that loads your files as they are, while reports that need edits favor a path with a designer for those edits.
Try the Report Writer export flow on a sample of your own RDLC files, or book an SSRS migration consultation with the Bold Reports team to review your RDL and RDLC inventory.
Frequently Asked Questions
- 1.
Is SSRS going away?
SSRS has no new versions after SSRS 2022, and Power BI Report Server becomes Microsoft’s default on-premises reporting solution starting with SQL Server 2025. SSRS 2022 still receives security updates and support through January 11, 2033, so existing server-hosted deployments have runway.
- 2.
When does SSRS 2022 support end?
Microsoft supports SSRS 2022 until January 11, 2033, in line with the SQL Server 2022 lifecycle. Microsoft also says SSRS 2022 can keep using later SQL Server Database Engine versions to host its reporting catalog. After that date, Microsoft ends security updates and support for SSRS 2022 (Microsoft Learn, checked October 13, 2026).
- 3.
Can I keep my RDLC report files when I move to .NET Core?
Yes, if the renderer you choose can load them. Microsoft documents its Report Viewer controls for WebForms and WinForms apps, so .NET Core teams need another renderer. According to the customer story, Si&T used the Bold Reports Report Writer to handle more than 600 RDLC reports during its move.
- 4.
Is Power BI Report Server a replacement for RDLC rendering inside my app?
No. Microsoft describes Power BI Report Server as an on-premises reporting solution for paginated RDL and interactive Power BI reports, licensed through SQL Server. It suits server-hosted reports. You deploy it as a server, so it does not render RDLC inside your .NET Core application.
- 5.
What is the difference between Bold Reports and Power BI Report Server?
Power BI Report Server is a server you deploy that hosts paginated RDL reports and interactive Power BI reports, licensed through SQL Server. Bold Reports is an embedded, paginated reporting platform with Report Viewer, Designer, Writer, and Server components for rendering RDL and RDLC inside your own application. Choose by whether you need a hosted server or embedded rendering.