 7 min read
Product
Create a World Population Report Using a Map
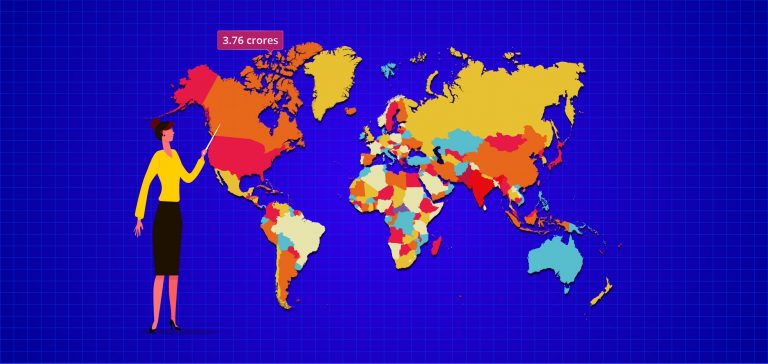
A map is a data visualization report item that can be used to present analytical data with a geographical background. It helps to visualize factors such as population density, election results, sales, weather, and popularity of social networking sites. From version 2.2.28, the Bold Reports Designer provides a map report item feature. In this blog post, we […]