
Crystal Reports to Power BI: What to Know Before You Migrate

TL;DR
While Power BI delivers interactive dashboards, self-service analytics, and advanced data visualization, it is not a direct replacement for Crystal Reports’ pixel-perfect reporting. Businesses with complex operational reports, invoices, and document-style reporting often need to rebuild reports during migration. For teams that require operational reporting, embedded reporting, and a smoother migration path, Bold Reports can be a stronger alternative.
Introduction
Many organizations considering migrating from Crystal Reports to Power BI assume Power BI is a direct replacement for Crystal Reports. However, the two platforms serve different purposes. Crystal Reports is designed for operational reporting and pixel-perfect reports, while Power BI is built for business intelligence, data visualization, and self-service analytics.
This distinction is critical when evaluating a Crystal Reports replacement. While Power BI delivers powerful analytics capabilities, it may not fully meet the needs of organizations that rely on invoices, financial statements, compliance documents, and other structured reports. As a result, businesses that migrate from Crystal Reports often need to rethink reporting workflows, user experiences, and reporting requirements.
Before starting a Power BI migration, it’s important to determine whether your goal is advanced analytics, modern reporting, or both.
In this guide, we’ll compare and contrast Crystal Reports and Power BI, look at common migration challenges and explain why a reporting-focused solution like Bold Reports may be a better Crystal Reports alternative.
Why organizations are migrating from Crystal Reports
Many organizations are reassessing their Crystal Reports investments with Crystal Reports 2020 mainstream maintenance ending in December 2026, and Crystal Reports 2025 following a year later, per SAP’s official product lifecycle documentation. SAP has also discontinued the 32-bit Crystal Reports .NET runtime as of December 2025, requiring applications built on it to move to the 64-bit runtime.
For businesses that depend on operational reporting, these changes are accelerating the search for Crystal Reports alternatives that preserve critical reporting capabilities. Choosing the right replacement depends on whether the goal is analytics, reporting, or a combination of both.

How to migrate from Crystal Reports to Power BI
Crystal Reports to Power BI migration requires careful planning, report evaluation, and redevelopment. While the exact process varies by organization, the following steps can help ensure a smoother transition.
Step 1. Assess and prioritize existing reports
Identify and document all existing Crystal Reports, including their data sources, embedded SQL queries, parameters, custom formulas, and dependencies. Categorize reports based on:
-
- Business function and purpose.
- Report usage and frequency.
- Report complexity.
- Operational or analytical use cases.
As a rough guide, most report libraries split into three tiers: roughly 50–60% are direct rebuilds with no complex logic, 25–35% require complex conversion work (subreports, crosstabs, running totals via WhilePrintingRecords), and 10–15% are candidates to retire or redesign entirely rather than migrate them as they are. Sorting reports into these tiers up front prevents the redevelopment budget from being consumed by the wrong reports.
Step 2. Identify reporting requirements
Not every Crystal Report should be rebuilt as a Power BI dashboard. Determine the purpose of each report and decide whether it should be migrated as:
-
- An interactive dashboard for analytics and KPI tracking.
- A paginated report for print-ready and operational reporting.
- A scheduled report for automated distribution.
Defining requirements early helps reduce redevelopment, streamline migration, and avoid unexpected costs. Organizations should also consider licensing requirements, as publishing and sharing paginated reports in the Power BI Service requires Premium Per User (PPU) licensing or Microsoft Fabric/Power BI Premium capacity.
Selecting the right reporting platform from the start can simplify migration, preserve existing workflows, and reduce long-term reporting expenses.
Step 3. Prepare and consolidate data sources
Review and identify all databases, queries, files, and other data sources used by your Crystal Reports. Consolidate disconnected data sources into a centralized, reusable data model and connect them to Power BI using native connectors for SQL Server, Oracle, SAP, and other supported platforms.
To optimize performance and scalability:
-
- Use Power Query to connect, clean, and transform data.
- Create reusable datasets for multiple reports and dashboards.
- Remove redundant queries and duplicate processing.
- Organize data using a star schema with fact and dimension tables.
- Validate data quality throughout the migration process.
A well-structured data model improves report performance, scalability, and consistency across your Power BI environment.
Step 4. Rebuild business logic and calculations
Crystal Reports formulas, parameters, and custom business rules cannot be directly migrated. These components typically need to be recreated using:
-
- DAX (data analysis expressions).
- Power Query transformations.
- Database views or stored procedures.
Carefully validating calculations during this phase ensures reporting accuracy and maintains consistency with existing business processes.
For example, a Crystal running total built with WhilePrintingRecords typically becomes a DAX measure using SUMX or a window function; a record-selection formula that filtered data at the report level becomes a Power Query filter step or a DirectQuery condition instead. Subreports have no direct Power BI equivalent, they’re usually replaced with drillthrough pages or bookmarked views built on top of the star-schema model from Step 3.
Step 5. Redesign reports and dashboards
Redesign existing Crystal Reports to take full advantage of Power BI’s interactive dashboard experience. Instead of replicating static reports, focus on creating intuitive dashboards that make data easier to explore, analyze, and act on.
Consider incorporating:
-
- Interactive dashboards for analytics and KPI monitoring.
- Drill-down and cross-filtering for deeper insights.
- Rich visualizations to replace static tables and charts.
- Consistent themes and formatting for a better user experience.
This helps deliver a more intuitive reporting experience, enabling users to access metrics faster and make better data-driven decisions.
Step 6. Configure security and data access
Review user permissions, data access policies, and governance requirements to ensure secure report access. Implement role-based security and data access controls so users only see the reports and data relevant to their roles, while protecting sensitive information and maintaining regulatory compliance across your Power BI environment.
Step 7. Test and validate reports
Compare Power BI reports with the original Crystal Reports to validate data accuracy, calculations, filters, formatting, and business logic. Conduct thorough testing with key stakeholders to ensure reports meet business requirements and deliver consistent results.
Comprehensive validation helps minimize reporting discrepancies, build user confidence, and ensure a smooth migration to Power BI.
Step 8. Train users and roll out migration
Provide training, documentation, and support to help users adapt to new reporting tools and workflows. Use a phased rollout approach to minimize disruption, gather user feedback, and encourage faster adoption across the organization.
This helps ensure a smooth transition and maximizes the value of your Power BI investment.
Crystal Reports-to-Power BI migration cost
The cost of migrating from Crystal Reports to Power BI can vary significantly depending on the size and complexity of your reporting environment. Beyond licensing, organizations should factor in report redevelopment, implementation services, user training, and infrastructure changes when estimating the total cost of migration.
1. Licensing costs
Power BI uses a subscription-based licensing model, with costs varying based on the number of users, sharing requirements, and deployment scale. When estimating migration costs, organizations should consider:
-
- Power BI Pro is $14 per user/month, and Premium Per User (PPU) is $24 per user/month, per Microsoft’s official pricing (effective April 1, 2025).
- Paginated (pixel-perfect) reports may require PPU or Microsoft Fabric capacity, depending on how reports are published and accessed.
- Free users can view paginated reports only in F64+ or Premium capacity workspaces.
Although Power BI can reduce reliance on legacy reporting systems, organizations should also evaluate whether additional tools are needed to support reporting needs.
2. Report redesign and redevelopment
Crystal Reports cannot be directly migrated to Power BI, so most reports must be redesigned and rebuilt. Migration effort typically depends on:
-
- The number of Crystal Reports in use.
- Report layout and formatting complexity.
- Custom formulas, calculations, and business rules.
- Data source integrations and connectivity requirements.
For organizations with many highly customized reports, redevelopment is often the largest migration cost.
3. Development and implementation effort
Beyond report conversion, successful migrations require planning, testing, and validation to ensure reporting accuracy and business continuity. Key activities include:
-
- Auditing and prioritizing existing reports.
- Designing new reports, and data models.
- Migrating and validating data sources.
- Testing calculations, filters, and business logic.
Larger and more complex reporting environments typically require greater development effort and cost.
4. Training and user adoption
Power BI offers a different reporting experience than Crystal Reports, making training essential for a smooth transition. Organizations may need to invest in:
-
- End-user training programs.
- Administrator and developer training.
- Documentation and knowledge transfer.
Effective training accelerates adoption and helps users get the most value from the platform.
When Power BI might be the right choice
Power BI is a decent Crystal Reports replacement when your primary goal is business intelligence rather than operational reporting. If most of your Crystal Reports are used for trend analysis and performance tracking, Power BI can be an effective modernization choice.

Where Power BI struggles as a Crystal Reports replacement
1. Recreating pixel-perfect reports can be difficult
Power BI is designed for dashboards and analytics, not highly formatted business documents. As a result, invoices, financial statements, compliance reports, and other pixel-perfect reports often require significant redesign.
2. Report redevelopment can increase migration costs
Crystal Reports cannot be directly converted to Power BI. Organizations often need to rebuild reports, formulas, parameters, and layouts, increasing both migration costs and timelines.
3. Limited support for operational reporting
Organizations that rely on scheduled reports, document generation, and routine operational reporting may find Power BI less suitable for these use cases.
4. Embedded reporting requires additional planning
Businesses delivering reports through applications, customer portals, or SaaS products may need specialized, embedded reporting capabilities beyond Power BI’s core strengths.
5. User adaptation may take time
Crystal Reports users are often familiar with structured, document-based reporting. Transitioning to Power BI’s interactive and self-service analytics experience may require training and changes to existing workflows.
Migrating from Crystal Reports: Power BI vs. Bold Reports
| Feature | Power BI | Bold Reports |
| Migration effort | High. Requires significant report redesign and redevelopment | Low |
| Report redevelopment requirements | High. Many reports must be rebuilt | Low. Supports a smoother transition from legacy reporting |
| Reporting workflow preservation | Limited. Often requires workflow changes | Strong. Preserves familiar reporting processes |
| Operational reporting support | Limited | Strong |
| Report type | Interactive dashboards. | Pixel-perfect and interactive reports. |
| Deployment options | Cloud, on-premises | Cloud, on-premises, hybrid |
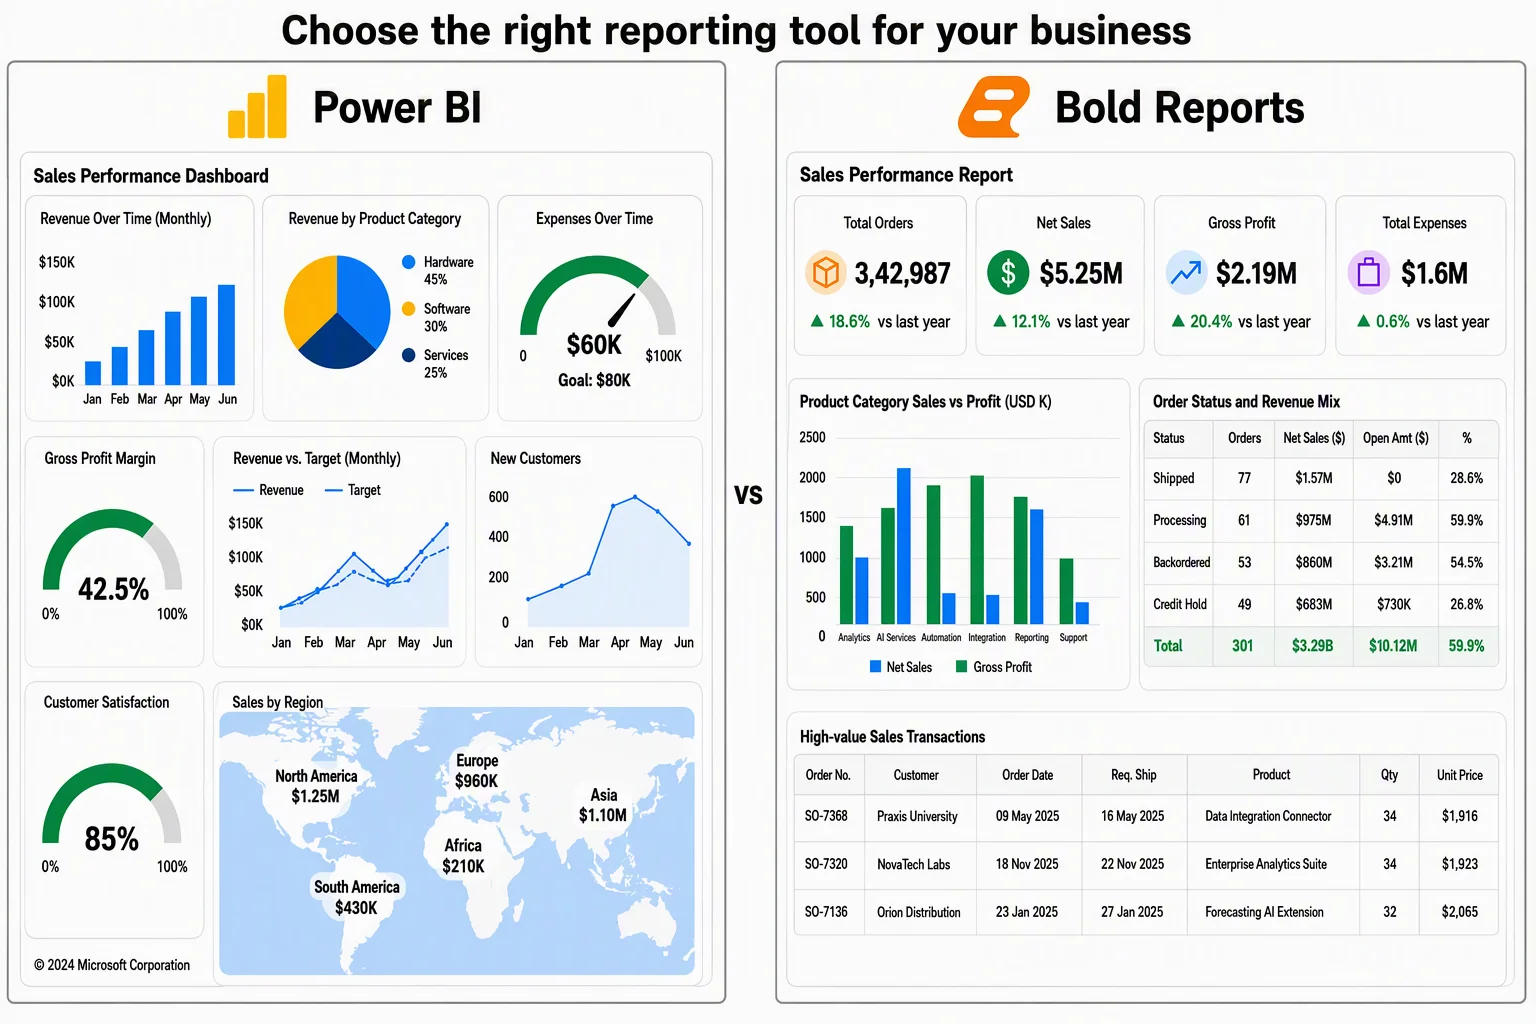
Why organizations choose Bold Reports as a Crystal Reports alternative
For many organizations, the biggest challenges in a Crystal Reports migration are preserving existing reporting workflows and not rebuilding every report from scratch. While analytics-focused platforms often require significant redesign efforts, Bold Reports helps organizations modernize reporting while maintaining the capabilities they already depend on.
-
- Minimize report redevelopment efforts: Crystal Reports often need to be rebuilt when moving to analytics-focused platforms. Bold Reports helps organizations modernize their reporting environment while preserving familiar reporting workflows, reducing redevelopment effort and migration risk.
- Preserve pixel-perfect report layouts: Crystal Reports is widely used for invoices, financial statements, compliance documents, and other highly formatted reports. Bold Reports supports pixel-perfect reporting, helping organizations maintain report accuracy, formatting, and document quality during migration.
- Modernize the reporting experience: Businesses that embed Crystal Reports within web applications and customer portals can modernize their reporting environment without significantly changing the user experience. Built-in embedded reporting capabilities make it easier to replace legacy reporting deployments.
- Maintain existing report delivery processes: Organizations can continue supporting scheduled report generation, automated distribution, and parameter-driven reporting while modernizing their reporting infrastructure.
- Reduce user adoption challenges: Unlike analytics-first platforms that may require extensive retraining, Bold Reports provides a familiar reporting experience that helps teams adapt more quickly.
- Choose the best deployment option: With support for cloud, on-premises, and hybrid deployments, organizations can modernize reporting while aligning with existing security, compliance, and IT requirements.
Power BI or Bold Reports: Which should you choose?
The right choice ultimately depends on your organization’s reporting goals. While both Power BI and Bold Reports help businesses gain meaningful insights from data, they are designed for different use cases.
Choose a business intelligence platform if your primary focus is:
-
- Interactive dashboards and data visualization.
- Self-service analytics.
- Real-time KPI monitoring.
- Advanced business intelligence.
- Data exploration and trend analysis.
Choose a reporting platform like Bold Reports if your primary focus is:
-
- Pixel-perfect reporting.
- Operational and regulatory reporting.
- Report scheduling and distribution.
- Embedded reporting within applications.
- Modernizing Crystal Reports with minimal disruption.
Final thoughts
Choosing the right Crystal Reports migration path starts with understanding your organization’s reporting requirements.
While Power BI is a decent platform for business intelligence, analytics, and interactive dashboards, it is not designed for reporting use cases. Organizations evaluating a Crystal Reports replacement should consider that Crystal Reports was built for operational reporting and pixel-perfect report delivery, requirements that often extend beyond analytics.
Before migrating, determine whether your priority is analytics and dashboards or modernizing enterprise reporting. If your focus is on data-driven insights, Power BI is a contender. However, if you rely on pixel-perfect reports or embedded reporting, a dedicated reporting platform may be a better fit.
For organizations modernizing operational reporting, Bold Reports provides a direct migration path, helping teams move beyond Crystal Reports while preserving the workflows and reporting experiences they depend on.
Ready to modernize your Crystal Reports environment? Request a demo or start a 30-day free trial to discover how Bold Reports can simplify your Crystal Reports migration. Should you encounter any challenges during the migration process, contact us for expert guidance and support to keep the transition on track.
Frequently asked questions
- 1.
How long does a Crystal Reports-to-Power BI migration take?
Simple reports may be migrated in a few days, while reports with calculated fields and filters typically take 4–8 weeks. More complex reports involving subreports or embedded SQL can take 2–4 months, depending on testing and validation requirements.
- 2.
Can Power BI fully replace Crystal Reports?
Not completely. Power BI is designed for business intelligence and interactive dashboards, while Crystal Reports is built for pixel-perfect reporting, document generation, and operational reporting workflows.
- 3.
Why do organizations choose Bold Reports instead of Power BI when replacing Crystal Reports?
Organizations choose Bold Reports because it is built for pixel-perfect reporting, report scheduling, and embedded reporting. For businesses replacing Crystal Reports, it offers a smoother migration path than Power BI and preserves familiar reporting workflows.
- 4.
What should I consider before migrating from Crystal Reports?
Evaluate your reporting requirements, migration effort, deployment preferences, and whether you need analytics, operational reporting, or both.
- 5.
Do I need both Power BI and Bold Reports?
Organizations can use Power BI for analytics and dashboards and Bold Reports for operational reporting and document generation. However, Bold Reports and Bold BI can complement each other better.
- 6.
What are the biggest challenges when migrating from Crystal Reports?
The biggest challenges are recreating existing reports, business logic, and workflows in a new platform while ensuring report accuracy and user adoption.
- 7.
How can I reduce the complexity of a Crystal Reports migration?
Choose a reporting platform like Bold Reports that supports familiar reporting workflows to help minimize redevelopment effort, simplify migration, and accelerate user adoption.
- 8.
Does Power BI support pixel-perfect or paginated reports?
Yes, through a separate tool called Power BI Report Builder. Publishing and sharing those reports require Premium Per User or Fabric capacity licensing.






