6 Best IT Reporting Tools to Consider in 2026
TL;DR
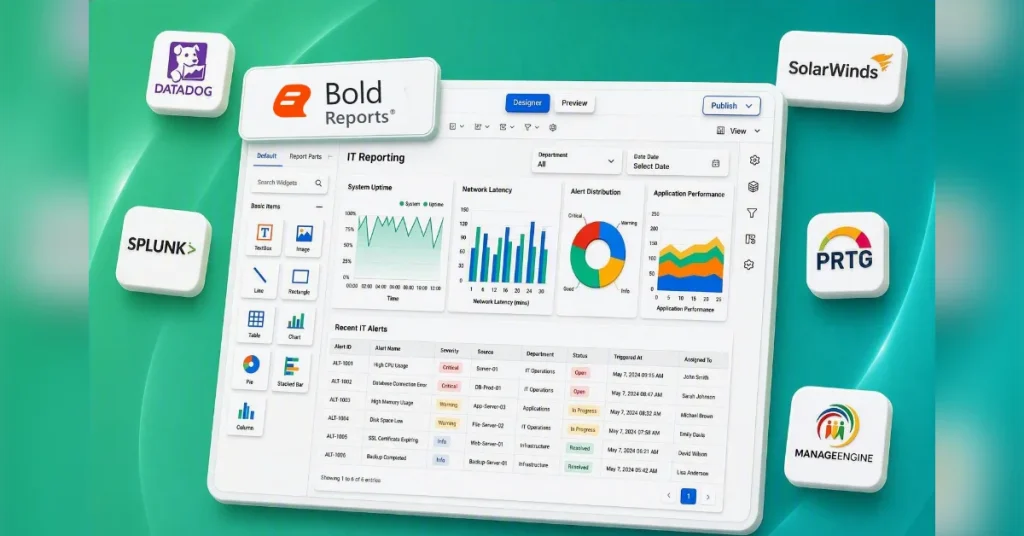
IT reporting tools help organizations collect, analyze, and visualize data from IT systems, networks, applications, and infrastructure. By providing real-time visibility into IT performance, security, and operations, these tools enable teams to automate reporting, track key IT metrics, improve compliance, and make data-driven decisions that enhance operational efficiency and business outcomes.
Introduction
IT reporting tools help organizations transform data from infrastructure, networks, applications, and service management platforms into actionable reports and alerts. Whether it’s monitoring system performance, tracking service-level agreements (SLAs), analyzing uptime trends, or supporting compliance initiatives, these tools give IT teams the visibility needed to make faster, more informed decisions.
As IT environments become increasingly complex, the cost of poor visibility keeps rising. According to Splunk’s The Hidden Costs of Downtime report, unplanned downtime costs Global 2000 companies a combined $600 billion annually, averaging about $15,000 per minute. The study also found that network and IT environment issues account for 43% of all downtime incidents, making them the leading cause of service disruptions. Additionally, ITIC’s 2024 Hourly Cost of Downtime Survey found that more than 90% of midsize and large organizations estimate the cost of a single hour of downtime at over $300,000.
The right IT reporting and monitoring software helps organizations identify issues sooner, monitor operational performance, automate reporting workflows, and communicate insights effectively to stakeholders.
In this guide, we’ll compare the best IT reporting tools in 2026, highlighting their key features, strengths, limitations, and use cases to help you find the right solution for your needs.
What is an IT reporting tool?
An IT reporting tool is a software application that collects, analyzes, and presents IT-related data in the form of reports and visualizations. It helps organizations monitor the performance, health, security, and usage of their IT infrastructure, applications, and services.
Modern IT reporting platforms often include automated reporting, real-time reports, and integration with multiple data sources, giving IT leaders a clear view of their technology environment and operations.

How we selected these IT reporting tools
To identify the best IT reporting tools for 2026, we reviewed solutions commonly featured in IT reporting, monitoring, observability, and infrastructure management software comparisons. We assessed each platform based on its reporting capabilities, monitoring features, deployment flexibility, pricing model, and overall fit for modern IT teams.
Our evaluation focused on the following criteria:
-
- Reporting depth: We evaluated each tool’s ability to create operational, compliance, SLA, capacity planning, and performance reports, as well as its support for report customization and automation.
- Real-time visibility: We assessed how effectively each platform delivers live reports, alerts, monitoring insights, and access to up-to-date operational data.
- Data integration and connectivity: We reviewed support for databases, cloud services, applications, monitoring tools, APIs, and other IT data sources.
- Deployment flexibility: We considered whether the solution supports cloud, on-premises, hybrid, or embedded deployments to meet different organizational requirements.
- Scalability and ease of use: We evaluated how well each platform supports growing data volumes, users, and reporting requirements while remaining accessible to IT teams.
- Unique value proposition: We selected tools that address different IT reporting needs, including operational reporting, infrastructure monitoring, security reporting, endpoint management, and embedded reporting.
6 IT reporting tools to evaluate
Choosing the right IT reporting tool depends on your reporting requirements, technical resources, and deployment preferences. To help you narrow down your options, here’s a closer look at six reporting solutions worth evaluating in 2026.
Note: Pricing and licensing may change over time. Verify the latest product information directly with each vendor before making a purchase decision.
1. Bold Reports
Bold Reports is an enterprise reporting platform that helps organizations transform IT and real-time data into pixel-perfect reports, compliance documents, SLA reports, and executive summaries. Designed for operational and compliance reporting, it enables IT teams to deliver accurate, stakeholder-ready insights across the organization.
The platform supports multiple data sources, automated report delivery, and self-service report creation. It also enables organizations to embed reports into web applications and SaaS products, making reporting more accessible and scalable.
Best for: Enterprise reporting, IT operational reporting, compliance reporting, and embedded reporting.
Key strengths:
-
- Pixel-perfect IT report generation.
- Automated report scheduling and delivery.
- Extensive data source connectivity.
- Embedded and white-label reporting capabilities.
- Self-service report designer.
Limitations: Some advanced implementations may require technical expertise.
Why choose this tool?
Choose Bold Reports if your organization needs a dedicated reporting platform for creating highly formatted reports, automating report distribution, and embedding reporting experiences into applications and customer portals.
Pricing: No per-user or per-developer fees. All plans are custom, based on the deployment model (cloud, managed private cloud, or on-premises). Includes a free 30-day trial, free migration, and a 30-day money-back guarantee.

Ready to enhance your IT reporting strategy? Try Bold Reports for free for 30 days and gain the visibility needed to monitor performance, track key metrics, and make informed decisions with confidence.
2. Datadog
Datadog is a cloud-based observability platform that helps organizations monitor infrastructure, applications, logs, and cloud services from a single dashboard. It provides real-time visibility into system performance, helping teams detect and resolve issues faster.
Best for: Infrastructure monitoring, real-time IT reporting, cloud-native DevOps, and SRE-led IT teams.
Key strengths:
-
- Real-time infrastructure and application monitoring.
- Unified visibility across logs, metrics, and traces.
- Extensive integration ecosystem.
- Customizable dashboards and alerts.
- Strong cloud monitoring capabilities.
Limitations: Costs may increase as data volumes and monitoring requirements grow.
Why choose this tool?
Choose Datadog if you need end-to-end visibility across applications, infrastructure, and cloud environments to improve operational performance and uptime.
Pricing: Infrastructure monitoring is $15 per host per month (Pro plan) and $23 per host per month (Enterprise plan) when billed annually. A free plan for up to 5 hosts and a free trial is also available.
3. Splunk Enterprise
Splunk Enterprise is a data monitoring and analytics platform that helps organizations collect and analyze machine-generated data from IT systems, applications, and infrastructure. It provides real-time visibility into operations through log analysis, dashboards, alerts, and reporting capabilities.
Best for: Security reporting, compliance monitoring, and log analytics.
Key strengths:
-
- Powerful log search and analysis.
- Advanced security reporting.
- Real-time monitoring and alerts.
- Custom dashboards and visualizations.
- Enterprise scalability.
Limitations: May have a more difficult learning curve for new users.
Why choose this tool?
Choose Splunk if you need real-time monitoring, log analytics, proactive alerting, and centralized visibility across applications, infrastructure, and IT operations to quickly detect issues and gain actionable insights from your data
Pricing: Splunk Enterprise pricing is custom, based on data ingestion or workload usage.
4. SolarWinds Observability
SolarWinds Observability is a full-stack observability and monitoring platform that helps organizations monitor IT infrastructure, applications, networks, databases, and cloud environments from a single interface. It provides real-time visibility into system performance, enabling IT teams to detect issues, reduce downtime, and improve operational efficiency through integrated monitoring, analytics, alerts, and reporting capabilities.
Best for: Enterprise network operations centers and infrastructure teams working on-prem or hybrid.
Key strengths:
-
- Comprehensive infrastructure visibility.
- Strong network monitoring capabilities.
- AI-powered anomaly detection.
- Cloud and on-premises monitoring.
- Flexible deployment options.
Limitations: Interface may be complex for new users.
Why choose this tool?
Choose SolarWinds Observability if you need a broad monitoring solution that provides visibility across your entire IT infrastructure from a single platform.
Pricing: SolarWinds Observability offers different pricing based on the observability capabilities you choose. Plans start at $5/GB/month for log observability, $10/month for synthetic monitoring and real user monitoring, $15.75/node/month for network and infrastructure observability, $27.50/service/month for application observability, and $70/database instance/month for database observability. A free trial is available.
5. Paessler PRTG Network Monitor
PRTG Network Monitor is a network and infrastructure monitoring solution from Paessler that helps organizations track the health and performance of networks, servers, applications, cloud services, and other IT systems from a single platform.
Using a sensor-based monitoring approach, PRTG provides real-time visibility into critical infrastructure, helping IT teams detect issues, receive alerts, and analyze performance trends through dashboards and reports.
Best for: Small-to-midsize IT teams that want monitoring and reporting running in hours, not weeks.
Key strengths:
-
- Fast setup with automatic network discovery.
- Sensor-based monitoring for detailed visibility.
- Real-time alerts and notifications.
- Supports networks, servers, cloud services, and virtual environments.
- Historical performance and trend reporting.
Limitations: Sensor-based licensing can become expensive as monitoring requirements grow.
Why choose this tool?
Choose PRTG Network Monitor if you need a straightforward monitoring solution that can quickly provide visibility into network performance, infrastructure health, and system availability. Its automatic discovery and preconfigured sensors make it particularly attractive for organizations with limited IT resources.
Pricing: A free edition covers up to 100 sensors. Paid tiers start at $200/month for 500 sensors (roughly 50 devices) and scale to $1,642/month at 10,000 sensors (roughly 1,000 devices).
6. ManageEngine Analytics Plus
ManageEngine Analytics Plus is an IT analytics and reporting solution that consolidates data from multiple IT management systems into a single reporting environment. It helps organizations analyze service desk, endpoint, network, and project management data through prebuilt reports and dashboards.
Best for: IT analytics, service desk reporting, and operational reporting. Mid-market IT teams wanting monitoring, ticketing, and reporting in one suite.
Key strengths:
-
- Centralized reporting across IT systems.
- AI-powered analytics assistant.
- Natural language querying.
- Cross-platform data analysis.
Limitations: Advanced reporting may require technical knowledge.
Why choose this tool?
Choose ManageEngine Analytics Plus if you want a centralized view of IT operations and performance across multiple management tools and data sources.
Pricing: Analytics Plus offers different pricing depending on whether you’re using cloud deployment or on-premises. For cloud deployments, the Personal tier is free and supports one user, the Professional tier is $199/month and supports two users and three viewers, and the Enterprise tier is $399/month for 10 users and 25 viewers. For on-premises deployments, the Free plan supports one user, the Standard plan starts at $995/year and supports two users, the Professional plan starts at $2,395/year for two users, and the For Enterprises plan pricing is custom.
IT reporting tools comparison
| Tool | Best for | Category | Deployment | Standout feature |
| Bold Reports | Embedding reports in applications and portals | Enterprise reporting | Cloud, managed private cloud, on-premises | White-label embedded reporting and pixel-perfect reports |
| Datadog | Cloud-native DevOps and SRE teams | Observability platform | Cloud | Unified view of logs, metrics, and traces |
| Splunk Enterprise | Security, compliance, and log reporting | Security and log analytics | Cloud, on-premises | Advanced log analytics and security reporting |
| SolarWinds Observability | Enterprise network operations centers and infrastructure teams | Infrastructure monitoring | Cloud | Prebuilt compliance and capacity-planning reports |
| Paessler PRTG Network Monitor | Small-to-midsize IT teams | Network and infrastructure monitoring | Cloud, on-premises | Sensor-based monitoring with automatic network discovery |
| ManageEngine Analytics Plus | Mid-market IT reporting and analytics | IT analytics and reporting | Cloud, on-premises | 400+ prebuilt IT reports and dashboards |
The evolution of IT reporting
As IT environments become increasingly complex, reporting tools are evolving beyond static reports. Organizations now expect faster insights, greater automation, and real-time reporting capabilities that support proactive decision-making.
Several trends are shaping the future of IT reporting:
-
- AI-powered reporting: Artificial intelligence is helping users identify trends, detect anomalies, generate report summaries, and uncover insights faster without extensive manual data analysis.
- Self-service reporting: Modern platforms are empowering business users to create and customize reports independently, reducing reliance on IT teams.
- Real-time reporting: With growing demands for operational visibility, organizations increasingly require live reports and up-to-date metrics for rapid decision-making.
- Embedded reporting: More businesses are integrating reporting capabilities directly into applications and customer portals to deliver insights where users need them most.
- Cloud-native reporting: Cloud-based solutions provide greater flexibility, scalability, and accessibility while simplifying deployment and maintenance.
- Data consolidation across multiple sources: Future reporting platforms will continue to improve their ability to unify data from on-premises systems, cloud applications, databases, and APIs into a single reporting environment.
Which IT reporting tool should you choose?
The right solution depends on whether your priority is advanced monitoring, enterprise IT reporting, compliance reporting, or IT operations reporting.
-
- Choose Bold Reports if you need to create pixel-perfect operational reports, automate report distribution, support compliance reporting, or embed reporting into applications and customer portals.
- Choose Datadog if your primary focus is real-time infrastructure monitoring, cloud visibility, and application performance monitoring.
- Choose Splunk Enterprise if you need advanced security reporting, log analytics, compliance monitoring, and threat investigation capabilities.
- Choose SolarWinds Observability if you’re looking for comprehensive monitoring and reporting across networks, servers, applications, and cloud environments.
- Choose Paessler PRTG Network Monitor if you want fast deployment, automatic network discovery, and straightforward monitoring and reporting without extensive setup.
- Choose ManageEngine Analytics Plus if you want centralized analytics and reporting across multiple IT systems, service desks, and monitoring platforms.
For many organizations, the ideal approach is not choosing between monitoring and reporting tools, but using both together. Monitoring platforms help collect and analyze operational data, while reporting platforms such as Bold Reports transform that data into executive summaries, SLA reports, compliance documents, and stakeholder-ready reports that drive business decisions.
Final thoughts
Choosing the right IT reporting tool is more than finding one capable of monitoring infrastructure or collecting operational data. The real value comes from turning that data into actionable insights that can be shared across teams, stakeholders, customers, and leadership.
While tools such as PRTG Network Monitor, Datadog, Splunk Enterprise, SolarWinds Observability, and ManageEngine Analytics Plus help organizations collect, monitor, and analyze IT data, organizations still need a reliable way to present that information through structured reports.
This is where Bold Reports stands out. It helps organizations create pixel-perfect reports, automate report delivery, and embed reporting into applications and portals. With extensive data connectivity and RDL/RDLC support, Bold Reports makes it easy to turn IT data into stakeholder-ready insights.
Ready to transform your IT reporting strategy? Start a free trial or request a demo to see how you can create, automate, and deliver impactful IT reports with confidence. Need help choosing the right reporting tool? Contact us for expert guidance in finding the best solution for your business needs.
Frequently asked questions
-
- 1.
How often should IT reports be generated?
The reporting frequency depends on the use case. Critical infrastructure and performance reports may require real-time or daily updates, while strategic and executive reports are often generated weekly or monthly.
- 2.
What industries benefit most from IT reporting tools?
IT reporting tools are widely used across all kinds of industries, including healthcare, finance, manufacturing, retail, and education. Any organization that relies on IT systems can benefit from better visibility into performance and operations.
- 3.
Can IT reporting tools help with compliance requirements?
Yes. Many reporting solutions help organizations generate audit-ready reports, track system activities, and maintain records required for regulatory standards such as GDPR, HIPAA, and SOX.
- 4.
Can IT reporting tools be embedded into existing applications?
Many modern reporting platforms support embedded reporting, allowing organizations to integrate reports directly into web applications, customer portals, and internal systems.
- 5.
How long does it take to implement an IT reporting tool?
Implementation time varies based on factors like deployment type, data source integrations, customization requirements, and organizational size. Cloud-based solutions are typically faster to deploy than on-premises platforms.
- 6.
Can IT reporting tools reduce reporting errors?
Yes. By automating data collection, report generation, and distribution, IT reporting tools reduce manual intervention and help improve reporting accuracy and consistency.
- 7.
Can recurring reports be delivered automatically?
Yes. Automated delivery helps distribute recurring infrastructure, incident, and operational reports to administrators, managers, and stakeholders.
- 1.