In this blog, I will explain the difference between drill-down reports and drill-through reports. Also, I will explain their features and use cases.
Drill-Down Report: Meaning
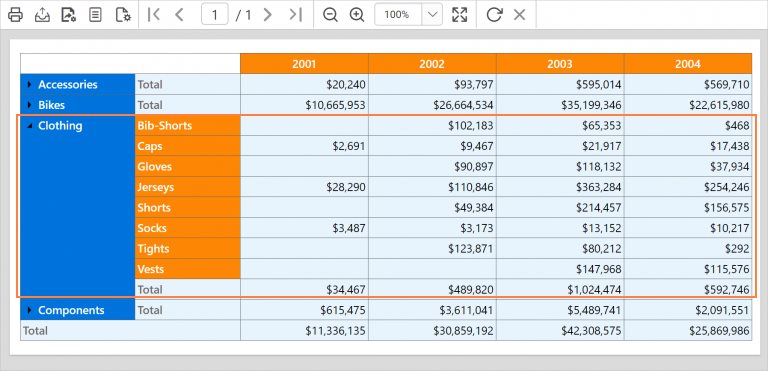
Viewing consolidated data in more detail is known as drilling down. A report that allows the user to navigate a hierarchical relationship between data is known as a drill-down report. For example, when a user clicks on a visualization, this report allows the user to view a granular level of data so that they can identify how the data was generated.
Example: Region > Country > State > Location
In the following screenshot, clothing sales by year are built upon granular data such as bib-shorts, caps, etc.
Drill-Through Report: Meaning
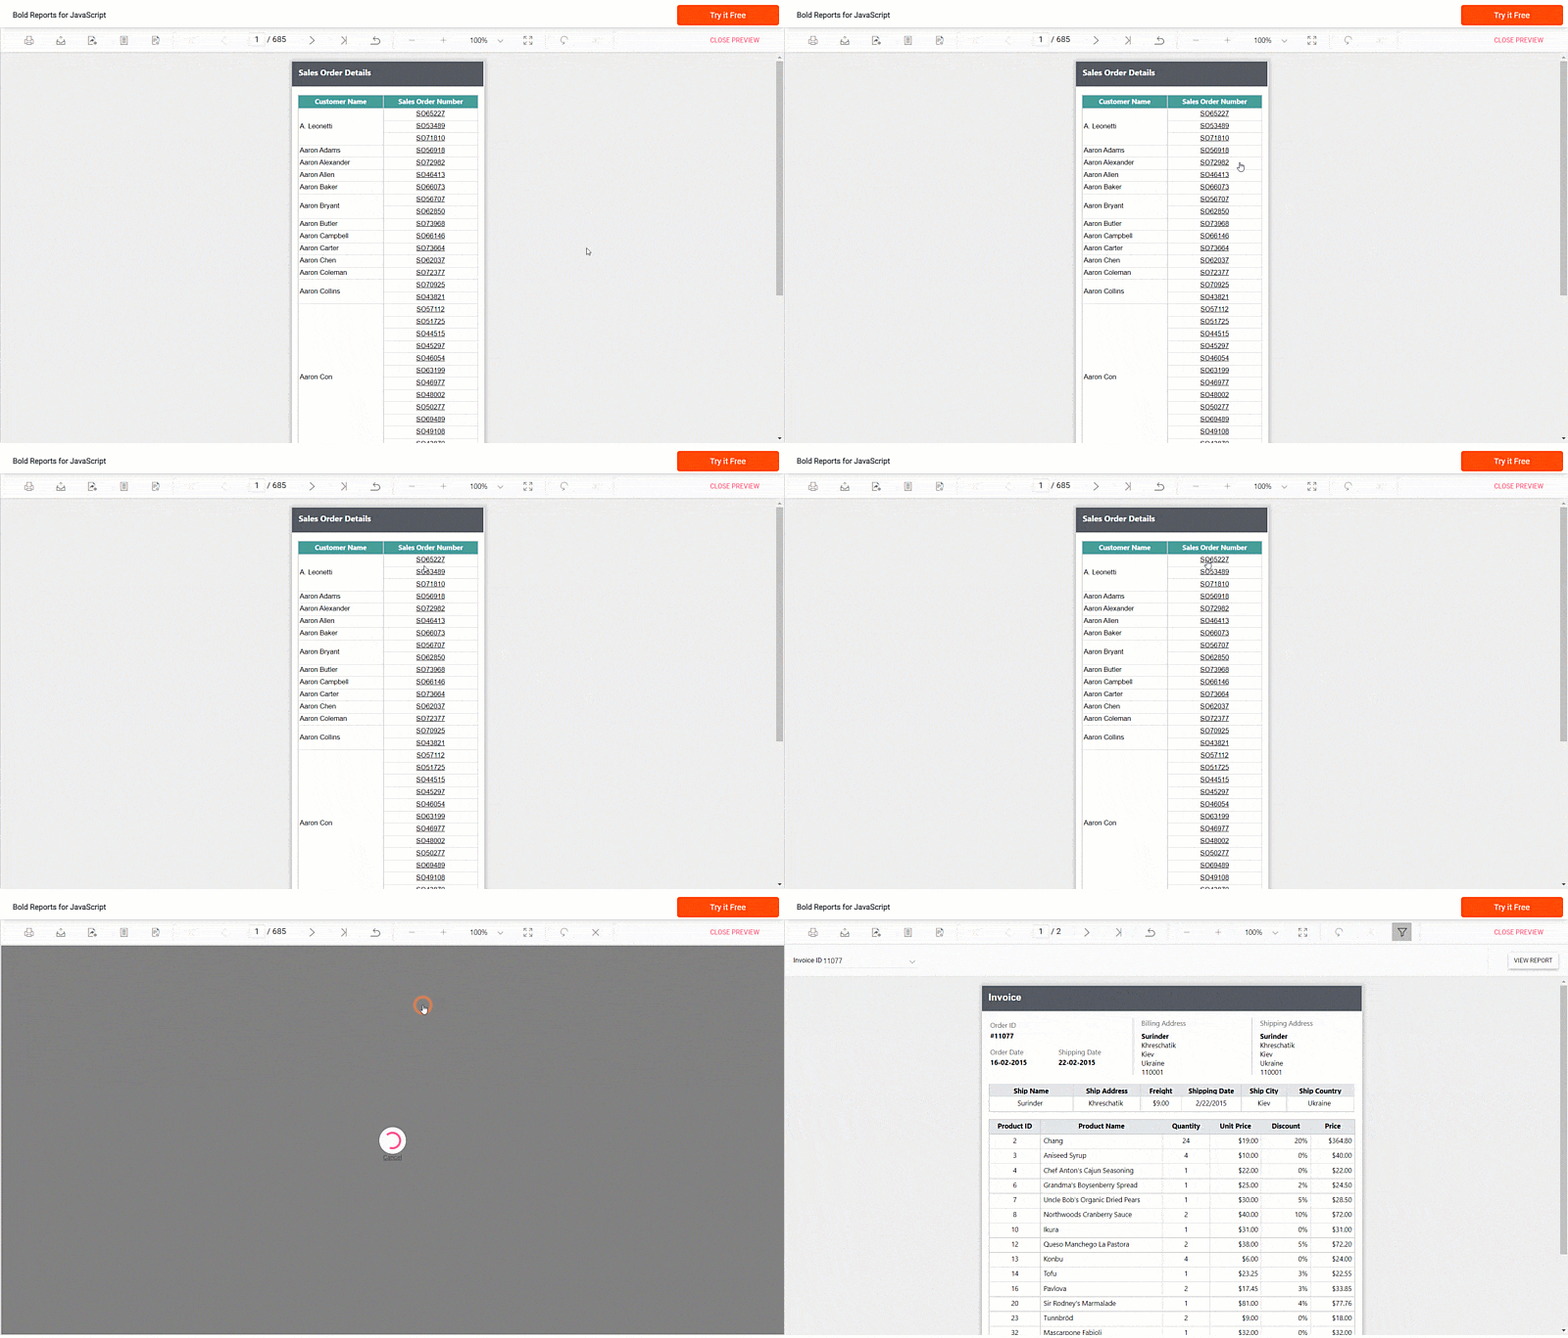
Viewing a different layer of data by clicking a visualization element is known as drilling through. Drilling through allows a user to understand another aspect of data that is related to the current data. It doesn’t show a granular view of the current data; instead, it shows a new way to analyze the current data.
In the following, clicking Sales Order Number drills through to a different perspective of the sales—the invoice.
In the following table, you can find the differences between drill-down and drill-through reports.
| Drill-Down Reports | Drill-Through Reports |
| Allows visualizing granular-level data. | Allows for analyzing relevant data instead of a granular view. |
| Filter parameters are not applicable for drill-down reports. | Can add parameters in the drill-through report to filter data based on a selection. |
| Drilling down can be achieved in a single view (i.e., you can drill down from the top level to the bottom level of the data in the same visualization). | Drilling through uses a selected data item, may use filters, and applies them to a page you are drilling through. |
Drilling Down in Bold Reports
Bold Reports® allows you to create reports with a drill-down feature. Drilling down is an interactive feature that can be configured on the same report, or it can open a different report using hyperlinks. Using the drill-down feature, you can show a complex report at the top level, and drilling down can show micro-level data so that users can identify the root cause of visualization findings. For more information about drill-down reports in Bold Reports, read the following blog: https://www.boldreports.com/blog/how-to-create-a-drill-down-report-using-report-designer.
Drilling Through in Bold Reports
Bold Reports also supports a drill-through feature. In drill-through reports, you can pass parameters to filter data. Using the Bold Report designer, you can configure drill-through actions for text boxes, cells of a table or matrix, images, and charts using the Link property listed in the report item properties. A drill-through action can be configured in the main report as a report action or a URL action. The report action allows the user to navigate from one report to another. For more information about drill-through reports in Bold Reports, read the following blog: https://www.boldreports.com/blog/step-by-step-procedure-to-create-a-ssrs-drillthrough-report.
Conclusion
I hope this blog provided a clear idea of the differences between drill-down and drill-through reports in Bold Reports. To explore further, go through our sample reports and Bold Reports documentation.
If you have any questions, please post them in the comments section. You can also contact us through our contact page, or, if you already have an account, you can log in to submit your support question.
Bold Reports® now comes with a 30-day free trial with no credit card information required. We encourage you to start a free trial and experience Bold Reports for yourself. Give it a try and let us know what you think!
Stay tuned to our official Twitter, Facebook, LinkedIn, Pinterest, and Instagram pages for announcements about upcoming releases.