
What Is ERP Reporting? A Complete Guide for 2026
TL;DR:
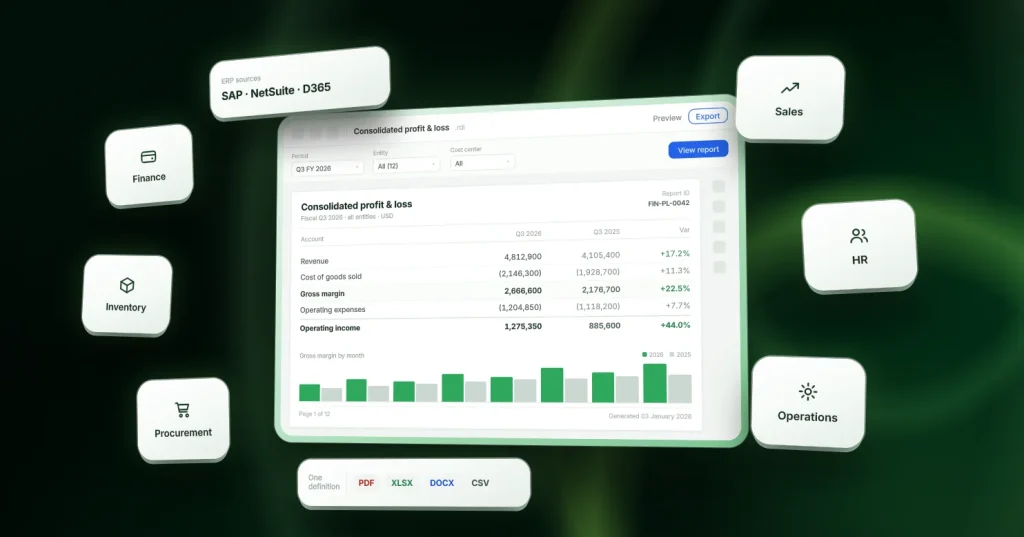
An Enterprise Resource Planning (ERP) system centralizes business data across finance, sales, inventory, procurement, and HR. ERP reporting turns that data into structured, actionable reports such as financial statements, inventory summaries, compliance filings, and operational reports. This guide explains ERP reporting, its key report types and KPIs, common challenges, and best practices for designing, embedding, automating, and modernizing reports using RDL-based reporting platforms instead of traditional BI dashboards or legacy reporting tools.
Introduction
Eighty-two percent of finance teams say poor data integration from platforms like ERP systems is their single biggest obstacle to accurate reporting and forecasting, according to insightsoftware’s 2024 Finance Team Trends Report. The same study found that ninety-three percent of finance teams juggle multiple software tools, and ninety-eight percent run into data integration problems as a result.
If you build, extend, or embed reporting inside an ERP or an ERP-adjacent application, that statistic is not surprising. It is the daily reality of pulling structured data out of finance, inventory, procurement, and HR modules, and turning it into something a controller, a warehouse manager, or an auditor can read.
This guide covers what ERP reporting is, the report types and KPIs that matter, the challenges that keep coming up, and the best practices that solve them. It also covers something most ERP reporting guides skip entirely: how to design, embed, and deliver ERP reports as a developer or ISV, using paginated, pixel-perfect report definitions rather than dashboards.
What Is ERP Reporting?
ERP reporting is the process of extracting, organizing, and presenting data from an enterprise resource planning (ERP) system, such as SAP, Oracle NetSuite, Microsoft Dynamics 365, Epicor, or Sage, into structured reports that support day-to-day operations and decision-making.
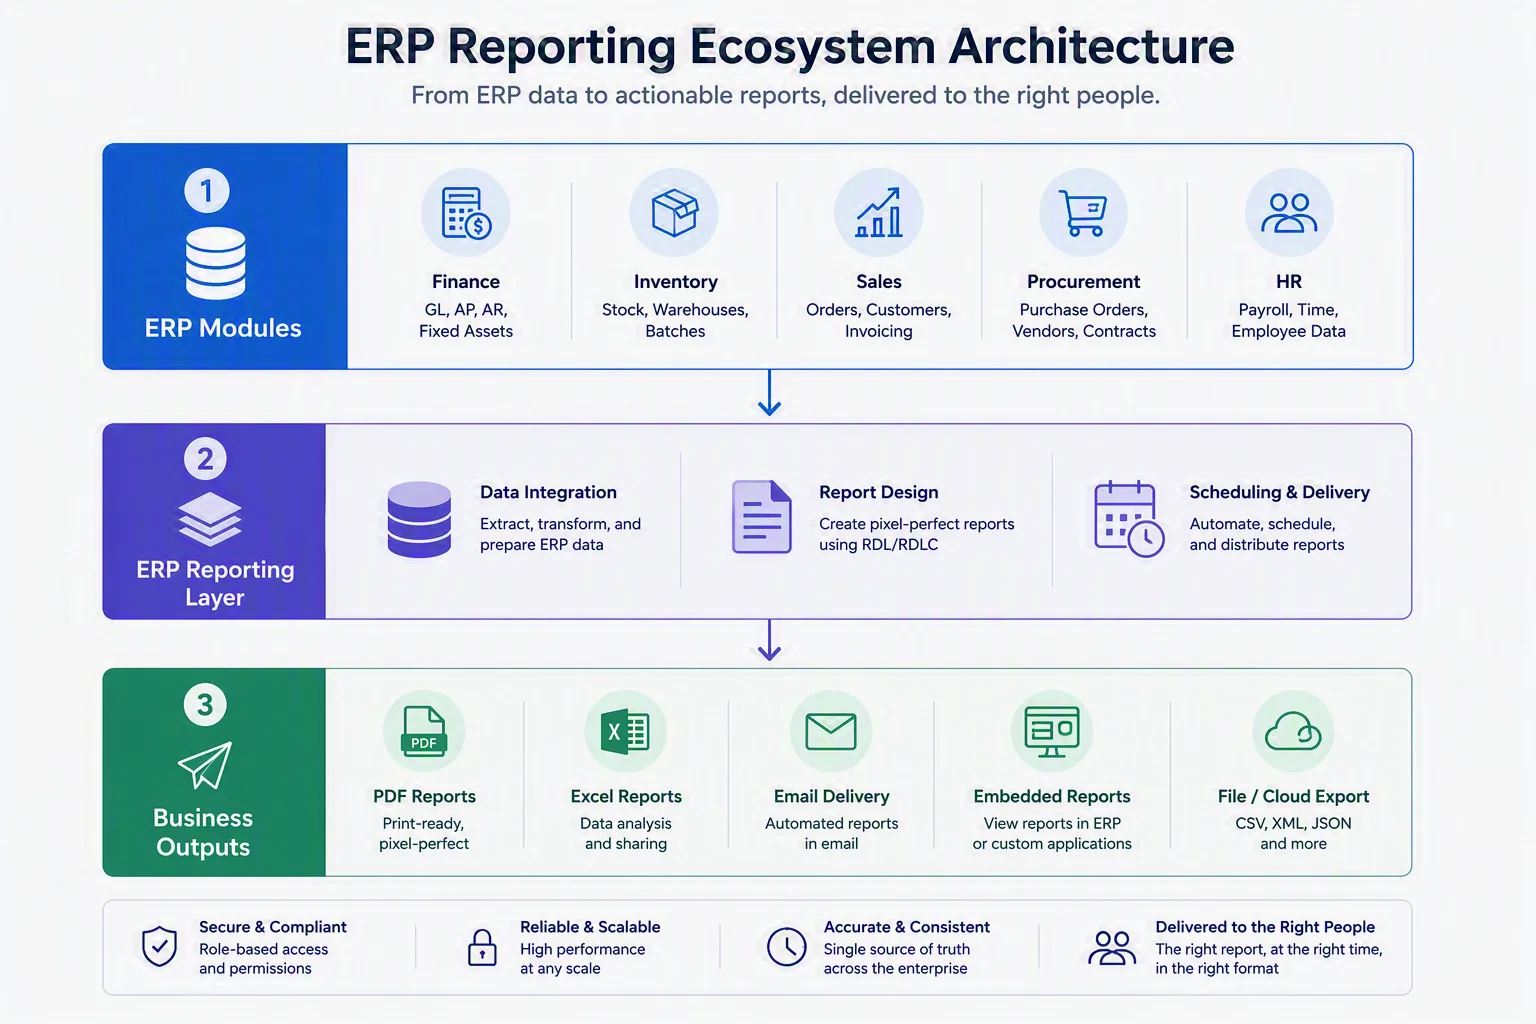
An ERP system centralizes data across finance, inventory, procurement, sales, and HR. ERP reporting is the layer that turns that centralized data into a document or view someone can act on: a monthly financial statement, a purchase order, an inventory valuation report, or a compliance filing.
It is worth being precise about scope here. ERP reporting is about generating structured, often paginated documents from ERP data on a defined schedule or on demand. It is a different discipline from business intelligence (BI) or predictive analytics, which focus on trend discovery, forecasting, and interactive data exploration. The next section draws that line clearly, because the two get conflated constantly, and conflating them leads to the wrong tool for the job.
ERP Reporting vs. BI and Analytics
| ERP Reporting | BI / Analytics | |
| Primary output | Structured, often paginated documents: invoices, statements, compliance reports | Interactive dashboards, visualizations, ad hoc exploration |
| Typical question answered | What happened, formatted for this audience, this format, this schedule? | Why did it happen, and what might happen next? |
| Layout requirement | Pixel-perfect, fixed layout, print-ready (page breaks, headers, barcodes) | Flexible, screen-first, resizable |
| Common triggers | Scheduled runs, transaction events, regulatory deadlines | User-driven exploration, KPI monitoring |
| Example tools | RDL/RDLC report designers, embedded report viewers, report servers | Dashboarding and self-service BI platforms |
Both are legitimate needs inside an ERP-driven business, and many organizations use both. But the tooling, the skill set, and the output are different. If your team needs a warehouse manager to print a pixel-perfect packing slip every time an order ships, a BI dashboard will not solve that. If your team needs to spot a trending anomaly in regional sales, a paginated report is the wrong tool. This guide focuses on the reporting side: designing, generating, and delivering structured ERP reports.
Types of ERP Reports
ERP reports are usually grouped by the business function they serve and by how far up the organization they travel.
| Report Type | What It Covers | Typical Consumer |
| Financial reports | Balance sheets, income statements, cash flow, general ledger detail | Finance, controllers, auditors |
| Sales reports | Revenue by product/region/rep, order status, sales forecasts | Sales leadership, RevOps |
| Inventory reports | Stock levels, valuation, reorder points, aging inventory | Warehouse, supply chain |
| Procurement reports | Purchase orders, vendor performance, spend by category | Procurement, finance |
| Operational reports | Production output, work order status, capacity utilization | Operations, plant managers |
| Exception reports | Overdue invoices, failed transactions, threshold breaches | Finance, operations |
| Compliance reports | Tax filings, audit trails, regulatory submissions | Finance, legal, compliance |
Reports also tend to sit at one of three altitudes:
-
- Operational reports are detailed, transaction-level, and used daily (an open sales order list, a picking list).
- Tactical reports roll up operational data for department heads on a weekly or monthly cadence (a regional sales summary, a procurement spend review).
- Strategic reports aggregate further still for executives (quarterly financial statements, board-level KPI packs).
Designing for the right altitude matters as much as designing for the right report type. A report built for a warehouse supervisor and a report built for a CFO should rarely share a template.
Key ERP Reporting Metrics and KPIs
The specific KPIs vary by module, but a few show up across almost every ERP reporting program:
-
- Financial: gross margin, days sales outstanding (DSO), operating cash flow, budget variance
- Inventory: inventory turnover, days of inventory on hand, stockout rate, carrying cost
- Procurement: purchase order cycle time, vendor on-time delivery rate, cost savings realized
- Sales: revenue by segment, quote-to-close time, forecast accuracy
- Operations: on-time production rate, capacity utilization, order fulfillment cycle time
Real-World ERP Reporting Use Cases
Report types and KPIs matter, but seeing them applied to a live report makes the idea concrete. Bold Reports maintains a set of ready-to-use ERP report templates that mirror the report types covered above. Four scenarios come up most often.
Financial performance
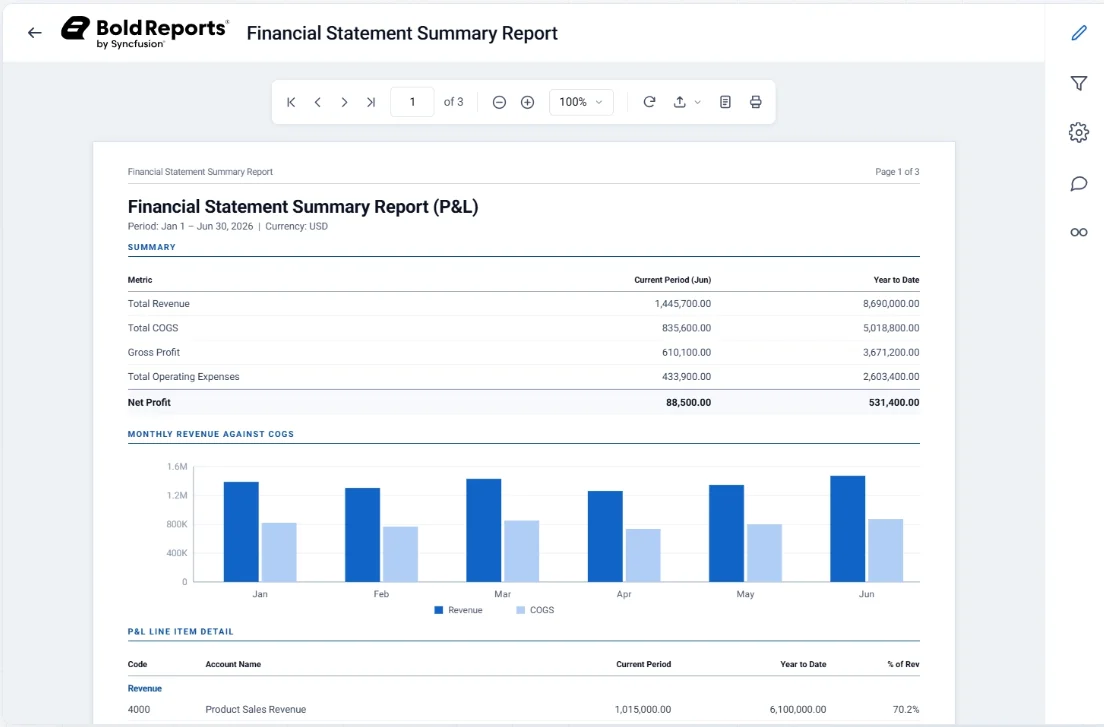
A consolidated view of revenue, direct costs, and margin trends across a reporting period gives finance teams one place to spot where profitability is improving or slipping, without exporting ERP data into a spreadsheet first.
- Compare revenue and direct costs across financial reporting cycles
- Track gross and net margin trends to gauge overall business health
- Review operating expenses across each spending category
Receivables and collections
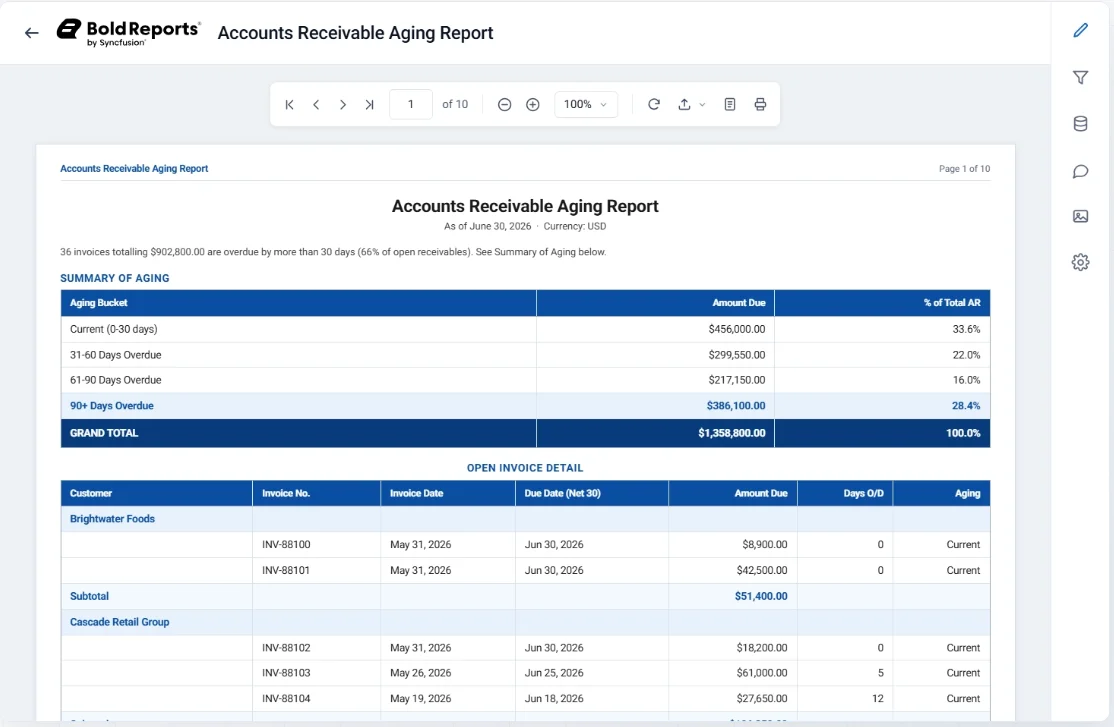
An accounts receivable aging report groups outstanding customer balances into aging buckets (current, 30, 60, 90+ days overdue), so collections teams can prioritize the invoices most at risk of becoming write-offs before they age further.
- Group unpaid balances into aging categories for faster review
- Flag customer invoices that need immediate follow-up
- Highlight balances approaching a critical delinquency threshold
Procurement
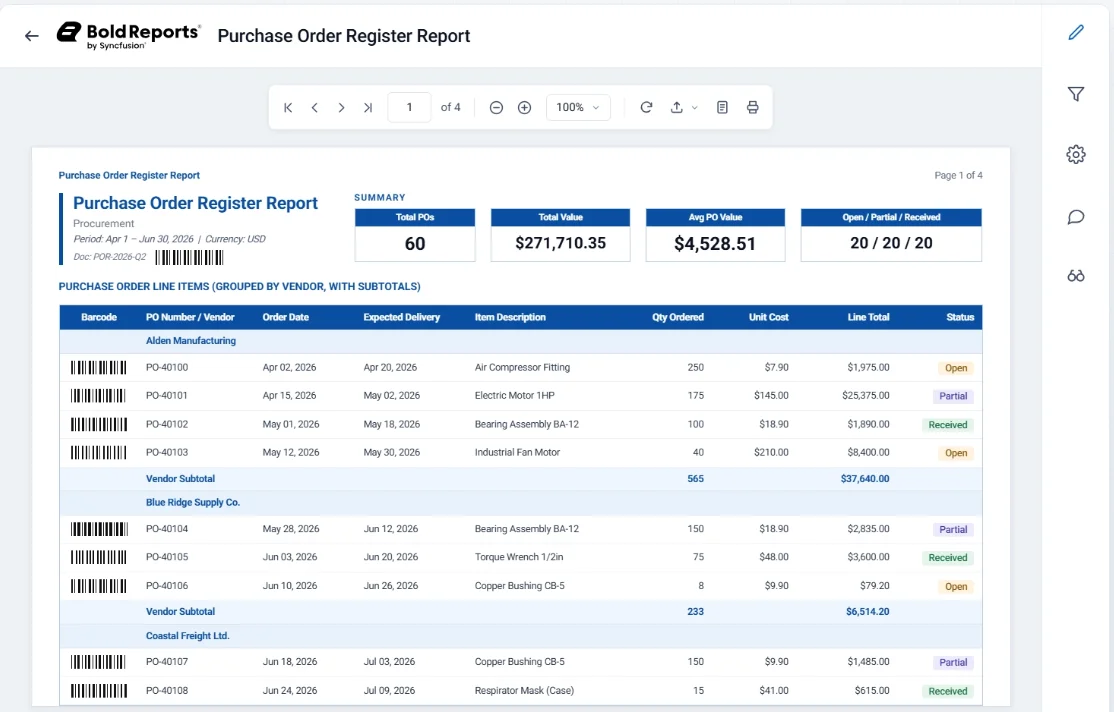
A purchase order register consolidates PO status, vendor commitments, and spend by category, giving procurement teams one place to track supplier performance instead of piecing it together across systems.
- Track purchase order progress across supplier relationships
- Break down purchasing activity by product type and spend area
- Measure vendor delivery performance against commitments
Executive and consolidated reporting
Executives rarely need module-level detail. They need revenue, receivables exposure, and procurement spend rolled into one strategic view. A consolidated report pulls from the same underlying ERP data used by finance, collections, and procurement, just aggregated for leadership review and planning.
Each of these views pulls from the same ERP data. What changes is the lens, not the numbers, the same point made earlier about designing reports for the right altitude and audience.
Common ERP Reporting Challenges
1. Data silos across modules
ERP systems bundle many modules together, but the reporting layer still must reconcile finance, inventory, and sales data that were entered by different teams on different schedules. According to Insightsoftware’s 2024 survey, 93% of finance teams use multiple software tools and 94% use tools from different vendors, and that combination drives the 98% data integration challenge rate cited above.
2. IT bottlenecks
Traditional ERP report writers require SQL or scripting knowledge. When a finance or operations team needs a new report format, they file a ticket and wait, sometimes for days, for IT or a developer to build it.
3. Manual export to spreadsheets
When self-service reporting isn’t available, teams export ERP data to Excel and manipulate it there. Insightsoftware found that over half of organizations spend at least 30 hours a month on top-level reporting tasks, with financial statement creation and ERP system maintenance among the most time-consuming activities. Separately, Datarails found that 40% of finance professionals still prefer spreadsheets over their ERP system for financial planning, and 82% describe an “emotional attachment” to Excel specifically. Spreadsheets exported from ERP data do not refresh automatically and are prone to version-control errors.
4. Rigid, one-size-fits-all templates
Out-of-the-box ERP reports rarely match a specific business’s layout, branding, or compliance requirements, which pushes teams toward manual rework.
5. Legacy reporting tools reaching end of life
Many ERP report estates were built on SAP Crystal Reports or SQL Server Reporting Services (SSRS). SAP Crystal Reports 2020 reaches the end of mainstream maintenance on December 31, 2026, and Crystal Reports 2025 follows on December 31, 2027. The 32-bit Crystal Reports .NET runtime was already discontinued after December 2025. RDLC and the classic ReportViewer control, meanwhile, were never ported to .NET Core, which leaves teams modernizing their applications with an aging reporting layer and no clear upgrade path.
6. Multi-tenant and embedding complexity for ISVs
If you are an ISV building an ERP-adjacent SaaS product, your customers expect reporting inside your application, not a separate BI tool they have to log into. That means tenant isolation, row-level security, white-labelling, and licensing that doesn’t charge per report viewer.
ERP Reporting Best Practices
- Establish a single source of truth before designing reports. Reconcile module-level data definitions (what counts as “revenue,” what counts as “shipped”) before building report logic on top of them.
- Standardize report templates by altitude. Keep operational, tactical, and strategic report templates distinct, with consistent branding and layout rules within each tier.
- Define KPIs before building the report, not after. A report built to answer a vague question tends to need rework. Confirm the specific metric, its formula, and its refresh cadence first.
- Reduce the IT queue with self-service parameters. Let business users adjust filters, date ranges, and groupings within a governed report template instead of filing a new ticket for every variation.
- Automate delivery on a schedule. Reports that need to reach the same audience every week or month should be scheduled and distributed automatically, not run manually.
- Design for print and export from the start. If a report will ever be printed, emailed as a PDF, or archived for audit, design it as a paginated, pixel-perfect layout rather than retrofitting a dashboard export.
- Plan your reporting layer’s modernization path separately from your ERP’s. ERP migrations and reporting-tool migrations don’t have to happen at the same time, but an aging reporting layer (unsupported Crystal Reports, unported RDLC) should be on its own roadmap.
How to Design and Deliver ERP Reports
This is the part most ERP reporting guides skip. Once you know what report you need, how do you build it, embed it in an application, and get it into the right hands-on schedule?
1. Design the report definition
Use an RDL (Report Definition Language) based designer to lay out the report: data regions, grouping, parameters, expressions, and page setup. RDL is a mature, portable standard, which means a report designed once can be rendered consistently across a desktop designer, a web-based designer, and a viewer control, and exported identically to PDF, Excel, Word, and CSV.
For a financial or compliance report, this typically means:
-
- Binding to one or more datasets (SQL, OData, REST API, or a stored procedure that already reconciles the ERP module data)
- Defining parameters (date range, cost center, entity) that let a business user adjust scope without touching the report definition
- Setting up grouping and subtotals (by region, by GL account, by vendor)
- Configuring page layout for print: headers/footers that repeat on every page, page breaks that respect logical groupings, and a fixed page size for compliance documents
2. Embed the report viewer in your application
For ISVs and internal developer teams, the report should render inside the application the user already works in, not a separate portal. A JavaScript-based report viewer component (with framework wrappers for Angular, React, Vue, and Blazor, plus native support for ASP.NET Core, WPF, and UWP) lets you drop a fully interactive report, complete with parameter prompts, export, and print, directly into an existing ERP-adjacent screen.
3. Add scheduling and automated delivery
For recurring reports (a weekly inventory valuation, a monthly close package), configure a report server to run the report on a schedule and deliver it by email in the required export format, without a person having to open the application and click “run.”
4. Secure it for multi-tenant use
If the report lives inside a multi-tenant SaaS product like Bold Reports, apply row-level security or a data-source filter tied to the logged-in tenant, and white-label the viewer chrome to match your product’s branding rather than a third-party reporting tool’s.
5. Export and archive
Every export format (PDF for print and audit trails, Excel for further analysis, CSV for downstream systems) should render from the same report definition, so a single design change propagates everywhere the report is consumed.
Modernizing a Legacy ERP Report Estate
Many ERP reporting problems today are not “we lack reports”; they are “we have hundreds of reports built on a tool that is aging out.” If your ERP’s reports were built in SAP Crystal Reports or classic SSRS/RDLC, the timeline above (Crystal Reports 2020 end of mainstream maintenance in December 2026, Crystal Reports 2025 in December 2027, and RDLC/ReportViewer’s absence from .NET Core) is worth putting on a roadmap now rather than reacting to it later.
Migrating an ERP report estate typically involves:
-
- Auditing the existing report inventory and identifying which reports are still in active use.
- Converting Crystal Reports (.rpt) files to the RDL format, either through automated conversion tooling or a rebuild for reports with heavy custom code.
- Validating that converted reports produce pixel-identical output, particularly for compliance and financial documents where formatting differences are not cosmetic.
- Rolling out the new reporting layer module by module rather than all at once, to keep the ERP’s day-to-day reporting running during the transition.
BrainTree replaced Crystal Reports as part of a cloud ERP deployment and migrated more than 4,000 reports and formats. Read the full BrainTree case study.
Choosing the Right ERP Reporting Approach
| Approach | Best For | Watch Out For |
| Native ERP report writer | Simple, low-volume reporting needs already covered by the ERP vendor | Limited customization, often requires vendor-specific scripting |
| Standalone BI/dashboard tool | Exploratory analysis, trend spotting, executive dashboards | Not built for pixel-perfect, print-ready, or compliance documents |
| Embedded RDL-based reporting platform | Custom, print-ready reports embedded directly in an ERP-adjacent or ISV application | Requires an initial report-design investment; not a fit if you only need ad hoc data exploration |
| Spreadsheet export | One-off analysis, small teams, no budget for tooling | No automatic refresh, error-prone, does not scale past a handful of reports |
For developers and ISVs building or extending ERP-adjacent software, an embedded, RDL-based reporting platform is generally the right fit when the requirement is structured, repeatable, print-ready reporting delivered inside your own application rather than a separate BI tool.
Final Thoughts
ERP reporting sits at the intersection of data that is already centralized and formats that still need to be exact: an invoice that has to paginate the same way every time, a compliance filing that can’t drift from last quarter’s layout, a vendor spend summary a procurement lead can filter without filing a ticket. Getting it right means treating reporting as its own discipline, separate from BI, with its own tooling, design process, and modernization timeline.
If you are evaluating how to design, embed, or modernize ERP reporting inside your own application, see how Bold Reports’ Report Designer, Viewer, Writer, and Server SDKs handle paginated, pixel-perfect reporting for developers and ISVs, or explore the Crystal Reports migration path if your ERP report estate is still running on legacy tooling. Request a personalized demo or start your free trial today!
Frequently asked questions
-
- 1.
What is ERP reporting?
ERP reporting is the process of extracting data from an ERP system’s modules (finance, inventory, procurement, sales, HR) and presenting it in structured reports such as financial statements, invoices, and inventory summaries.
- 2.
What is the difference between ERP reporting and BI or analytics?
ERP reporting produces structured, often paginated documents for a defined audience and schedule. BI and analytics tools are built for interactive exploration, trend discovery, and forecasting. The two are complementary but require different tooling.
- 3.
What are the main types of ERP reports?
The main categories are financial, sales, inventory, procurement, operational, exception, and compliance reports, typically organized across operational, tactical, and strategic tiers.
- 4.
How do you create a custom report in an ERP system?
Most custom ERP reports are built with an RDL-based report designer: bind to the relevant dataset, define filtering parameters, configure grouping and page layout, and publish the report definition to a viewer or report server.
- 5.
Why is ERP reporting important?
ERP reporting turns raw operational data into documents that finance, operations, and compliance teams can act on. Without it, teams fall back on manual spreadsheet exports, which introduce delays and errors.
- 6.
Can ERP reports be embedded inside another application?
Yes. A JavaScript-based report viewer with framework support for Angular, React, Vue, Blazor, and native .NET can render ERP reports directly inside an existing application, rather than requiring users to open a separate reporting portal.
- 7.
What should I use instead of Crystal Reports or SSRS for ERP reporting?
Since SAP Crystal Reports is approaching the end of mainstream maintenance, and RDLC/ReportViewer were never ported to .NET Core, many teams are migrating to modern RDL-compatible platforms that support .NET Core, embedding, and multi-tenant deployment.
- 1.






